- ES Daily making another bullish attempt out of the Ascending triangle.
- Bulls manage to close above 20 Day SMA Despite many attempts by bears to stay below that line.
- 5 Minutes chart as Immediate support for the Day.
-->
- Nifty month chart did a Morning start kind of reversal . The negative divergence in daily chart was negated by the bullish formation in Month time frame.
- Price is now entering previous resistance zone between 8810 to 9119.
- Only if price is able to sustain above this zone a bigger breakout can be confirmed. Daily and weekly candles if shows weakness in this zone can lead to a reversal.
-->
- ES bulls trying to stay above trend line drawn in 4 hour chart and 200 Period SMA. too many tests on this level could lead to a breakdown. On the contrary if price takes another support a bigger bounce is possible.
- Levels for the day is shown in chart 3. Price likely to trade between 2251 - 2262 - 2281. Bigger direction possible only on breaking out of the range between 2262 and 2281
-->
- ES 4 Hour time frame shows the 200 Period SMA and the support line saving bulls from a bigger fall.
- Now price is testing the previous resistance line which is around 2281 for now. This level must be crossed for this bounce to extend towards all time high's again. As of now 2281 levels is acting as resistance.
-->
- Nifty daily chart shows negative divergence with MACD Histogram. This is a risky setup for today as volatility is likely to increase because of the News.
- The extreme levels for the Day are 8672 on Top and 8461 and 20 Day SMA as support levels. If these levels are broken on closing basis bigger directional moves in that direction possible in the coming days.
- Week chart shows historic resistance near 8650 levels approx. So a weekly close above this level should give new highs for bulls. For bears its a daily close below 20 Day SMA.
-->
- 4 Hour chart shows price testing crucial support line and 200 Period SMA for this time frame. Sustaining below this line or 2260 levels may extend the fall towards 2250 for the day. Strength here can take price back towards 2278 levels again.
- Levels in first two charts are crucial for bulls to hold to keep the bullish structure intact.
- RUSSELL 2000 BROADENING TOP
-->
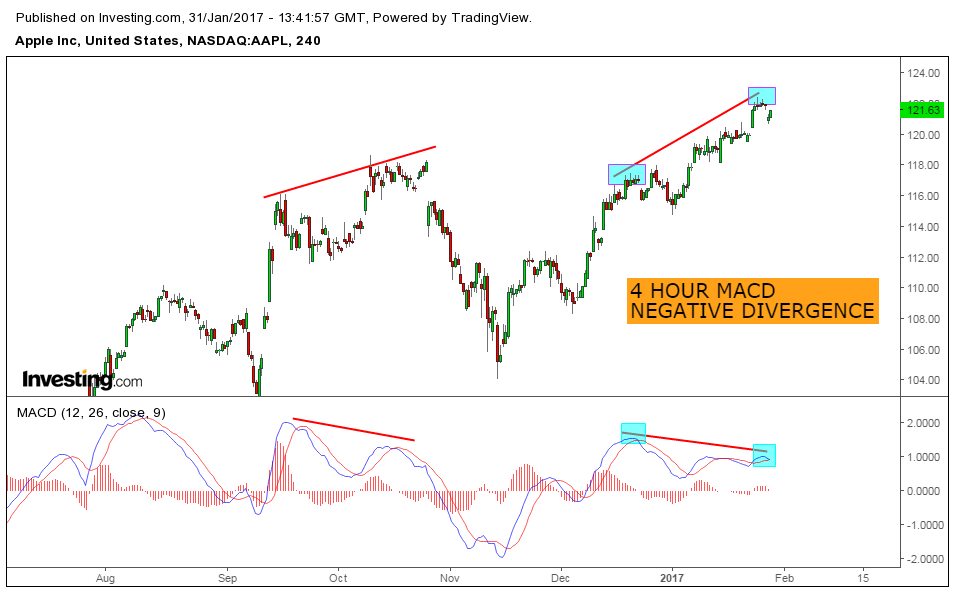
- Apple 4 Hour chart shows negative divergence.
- 2nd chart shows price testing resistance line in daily chart.
- Last chart is the 4 hour time frame again with a rising wedge kind of contraction.
-
ES Analysis before opening bell
-->