- Possibility of testing 100 SMA came true today But it was rather swift. More important is the fact that Bulls managed to hold on to this line to avoid further weakness.
- Now the 100 SMA line and the 20 Week SMA shown in weekly chart is crucial. If these levels are tested again within this series then bigger falls are possible.
- Crucial number in Month chart is 10530. Bulls need to stay above this number to avoid a bearish engulfing in this time frame.
- NIFTY Weekend update
My blog Analyses the trend and patterns of stocks, Futures, Commodities and Forex Markets
February 6, 2018
NIFTY Bounce from 100 SMA
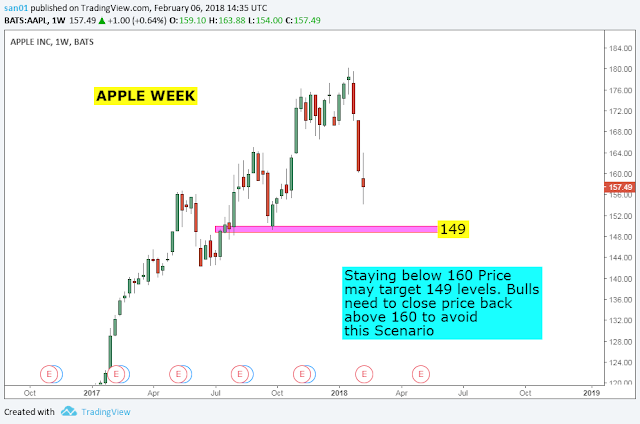
APPLE Chart Analysis
- Bears need to keep price below 200 SMA in daily time frame to sustain weakness. Bulls may do a bigger reversal if daily is able to close back above this line.
- Staying below 160 Week may target 149 levels.
- For the very short term one can follow 30 Minutes and one hour cloud. Price moving above 30 Minutes cloud may weaken bears.
ES Chart analysis before opening bell
- Daily time frame shows price below 100 SMA and Ichimoku cloud. Price staying below this level will favour bears. Bears need one full candle below these levels to avoid a Fast reversal.
- One hour is trending below the cloud. For a meaningful bounce to happen price must first move above the hourly cloud. As long as price stay below hourly cloud it will form new lows.
- ES Weekend update
ES Analysis after closing bell
- Daily cloud base is around 2621. The current candle must do a big reversal and close above 2621 levels to save the cloud base for bulls. Bears on the other hand need to form a full candle below the cloud to strengthen further.
- Week has gone below 20 Week SMA. Staying below 2651 Bears likely to target 2500 and 2450 levels.
- Month continue to engulf multiple bull candles. Month close below 2670 will confirm bearish engulfing at the top.
- ES Weekend update
Subscribe to:
Comments (Atom)


