- 4 Hour chart shows price breaking support levels
- Daily chart shows price moving towards 200 Day SMA.
- 50% retrace level is also a potential support level.

- Apple 30 Minutes shows price continue to break support levels.
- Daily chart is threatening to break 200 Day SMA, Bears need this level to be broken on closing baiss for pushing the stock possibly towards 570 and 550 levels.
- Weekly cloud shows the long term trend of the stock is very well intact. Price last said good bye to to the weekly cloud when it was trading around 144 levels. We may see a retest of the weekly cloud only if the 200 SMA is broken on closing basis.
- NFLX CHART ANALYSIS
- ES 30 Minutes shows the range breakout following positive news.
- But 4 Hour chart shows price nearing Golden ratio.
- Daily chart shows price about to retest 50 Day SMA. These two levels on the bigger time frame may act as resistance for the bulls.
- S&P 500 ANALYSIS AFTER CLOSE
-->

- First chart is the weekly time frame of NFLX With Resistance levels or targets for the contraction pattern breakout.
- Second chart shows price getting resisted at 38.2% Fib levels.
- Last chart shows price testing 50 Week SMA. Bulls need a close above this line for a bigger up move to happen.
- Today being a weekly close bulls would need a daily and weekly close above all the levels mentioned above to sustain the up move into next week.
- Failure to close the day above the falling resistance line and 5 Day High EMA would signal weakness.
- S&P 500 EOD UPDATE
-->

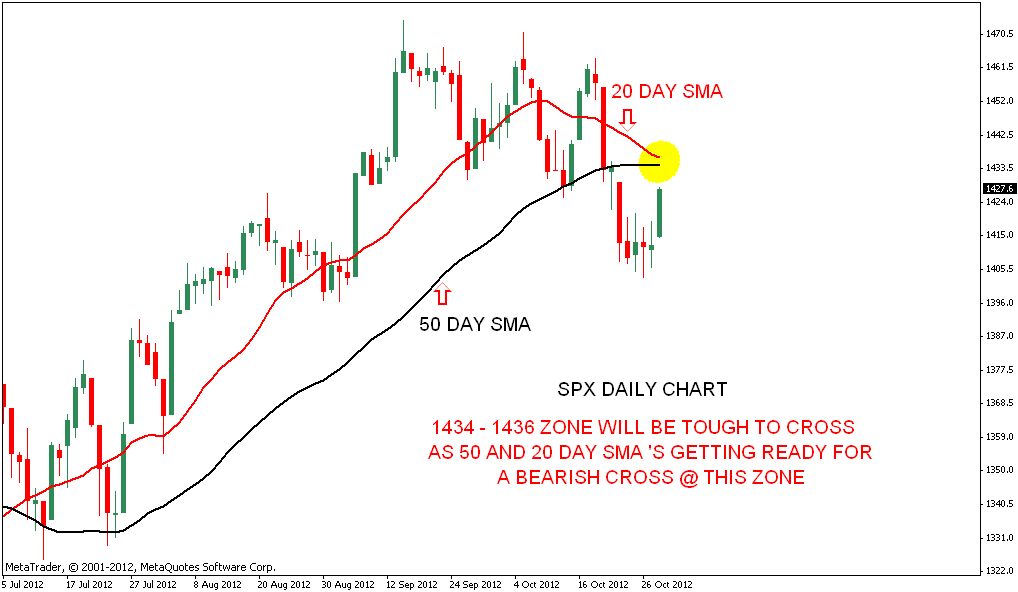
- SPX Daily chart has moved above crucial support resistance zone But will find it tough to cross 1434 - 1436 zone.
- 50 and 20 Day SMA are getting ready for a bearish cross at 1434 - 1436 zone. So if bulls are strong we should see a close above this level.
- 30 Minutes chart sustaining above the cloud should help bulls to extend the up move.
- GOOGLE CHART ANALYSIS
-->

- QQQ 4 Hour chart shows bulls trying to protect 64.60 - 65.30 zone. This zone acted as resistance and it is acting as support now. Bears must break below this level for a bigger breakdown.
- One hour chart shows resistance at 100 Hour SMA. Price must sustain above this level for a bigger up move to happen.
-
FORD MOTOR IHNS PATTERN
-->