- QQQ Falling from the resistance line of the triangle pattern.
- Price may target the 200 Period SMA and the support line of the triangle
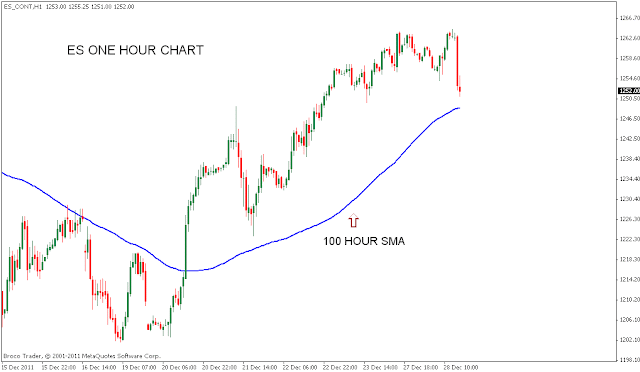
- ES NEGATIVE DIVERGENCE GIVES A CORRECTION
My blog Analyses the trend and patterns of stocks, Futures, Commodities and Forex Markets
December 28, 2011
QQQ Falling from the resistance line
U.S Dollar with Ichimoku cloud
- First chart is U.S Dollar Month time frame shown with ichimoku cloud.
- Price is unable to move above the cloud. Month closing below the cloud will be negative.
- Daily chart is shown with a trend line. Holding this trend line U.S Dollar may give another up move. U.S Dollar has negative Divergence as shown in the Previous Post of U.S Dollar. Breaking below the trend line will extend correction.
BANK NIFTY Analysis
- Bank Nifty Weekly chart seems to have bottomed for now. Supporting bullish candle formed at the parallel line can give good bounce. Having said that A retest of the lows is possible if 5 Day Low EMA gets broken on closing basis. If that down move comes with positive divergence we may see a larger bounce for next series. For Bulls price has to break above 20 Day SMA and the resistance line of daily chart.
- CNX IT CHART ANALYSIS
CNX IT Chart Analysis
- CNX IT is consolidating between 50 Day SMA and 200 Day SMA. Breakout on either side on closing basis may give good direction. Bullish attempts are getting failed So bears seems to have good risk reward ratio. Having said that it's no use anticipating a move so lets wait for crucial levels or moving averages mentioned in the charts to be violated on closing basis.
- BANK NIFTY ANALYSIS
Subscribe to:
Comments (Atom)


