- SPY Weekly chart shows a reversal from 50 Week SMA Pending today's close.
- Daily chart also shows price back above 20 and 200 Day SMA. Close today at the current levels or higher above 20 SMA should add strength for the daily time frame.
- Next crucial resistance levels or target for the up move could be the 50 Day SMA or the Golden Ratio.
- QQQ CHART ANALYSIS\

- QQQ Breaks above the falling resistance line.
- Price testing 50 Day SMA and Testing 38.2% Fib level. Breaking above these two levels on closing basis may give a bigger up move in QQQ.

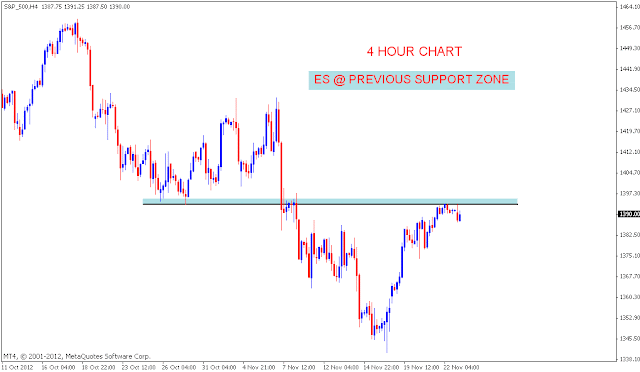
- ES Testing previous support level around 1393 which may act as resistance.
- If price manages to trade above the previous support zone we may see an up move towards the falling resistance line and 200 Period SMA were it is likely to get resisted.
- Bank nifty has given a shooting start or Inverted Hammer pattern. Its a bearish pattern.
- For bears if this candlestick is to work price should trade below 11460 which is the 20 Day SMA.
- last chart shows price right in the middle of the range. Sustaining above 20 SMA will favor bulls. Falling below it could lead to 11260 levels.
-
BANK NIFTY LIVE CHART WITH AUTO REFRESH


