- QQQQ 30 minutes chart with triangle and selling zone.
- Breakout from triangle should close above the resistance zone (54.55 - 54.73).
- Breakdown should sustain below the 50 hour moving average to give good results for the bears.
- DOW JONES HOUR CHART ANALYSIS
My blog Analyses the trend and patterns of stocks, Futures, Commodities and Forex Markets
December 17, 2010
QQQQ Triangle pattern
SPY Hour chart analysis
- SPY Hour chart with today's GAP and 50 hour moving average.
- 124.02 is an important support. Hour closing below this level will be negative.
- Price is trading below 50 hour moving average. If price manages to get back above 50 hour moving average the GAP may get filled.
- DOW JONES HOUR CHART ANALYSIS
Dow Jones Support and resistance levels
- Dow Jones hour chart is trending up above 50 hour moving average.
- Important levels for today are 11471 below that level we have the 50 hour moving average and then 11422.
- Resistance is at 11512 break above this level will give an up move. Break of 50 hour moving average will be negative.
- S&P 500 ANALYSIS AFTER CLOSING BELL
S&P 500 Analysis after closing bell
SPX 30 MINUTES CHART
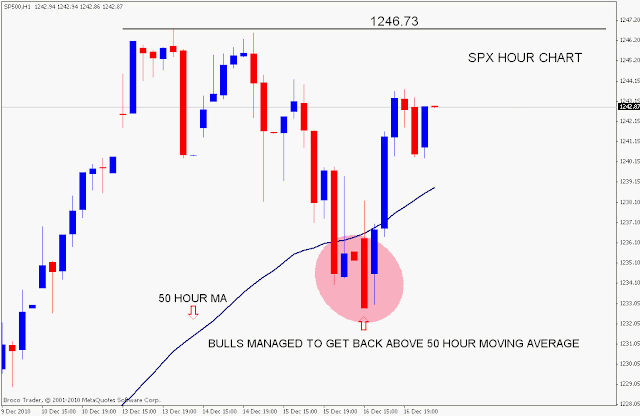
SPX 60 MINUTES CHART WITH 50 HOUR MA
SPX DAILY CHART
- SPX 30 minutes line chart shows the v shaped reversal. Price came down from 1246 levels to 1232 level But bulls managed to retrace fast. 78.6% retrace is completed. Staying above 1240 will help bulls cross the recent high easily.
- Price did not last too long below 50 hour moving average. Price was there for few hours but managed to close above it again. Bears should make it sustain below 50 Hour MA for some bigger falls to happen.
- Daily chart shows that much of the negative price action created by the shooting star candlestick has gone now. If price manages to close above the tail of the shooting star it will clear the way for next up move above 1250.
- BAIDU GIVES A SELL FROM ITS DIAMOND PATTERN
Subscribe to:
Comments (Atom)


