- Bulls are getting support at 100 Period SMA of four hour chart as shown in first chart. Bears need to break this level for extending gains.
- Second chart shows immediate price support levels.
- Last chart shows Fib support levels.
-
APPLE CHART UPDATE
-->
- Weakness at 50 Day SMA and four hour cloud.
- Price falling towards 200 Hour SMA. More weakness if 200 Hour SMA Does not hold.
-->

- Crude oil daily chart getting resisted at previous support level.
- Broken 50 day sma too is acting as resistance.
- APPLE Daily chart has violated the down trend line from 705 levels.
- Price is nearing Daily upper bollinger band and 50 Day SMA.
- Daily close above 50 SMA and Upper bollinger band may help bulls to extend this up move.
- S&P 500 ANALYSIS AFTER CLOSING BELL
-->

- ES bulls continues to struggle at 78.6% Fib level and the channel support line.
- Price is staying above crucial moving averages as shown in last chart.
- For bears price sustaining below 50 Period SMA may lead to a bigger fall.
- SPX Daily taking support at 23.6% Fib level.
- Second chart shows price testing middle line of the ascending channel. Price has to close below this line for bears to have a correction towards 1530 levels initially.
- Weekly chart shows negative divergence with price and rsi. RSI falling below 70% line may give a bigger fall.
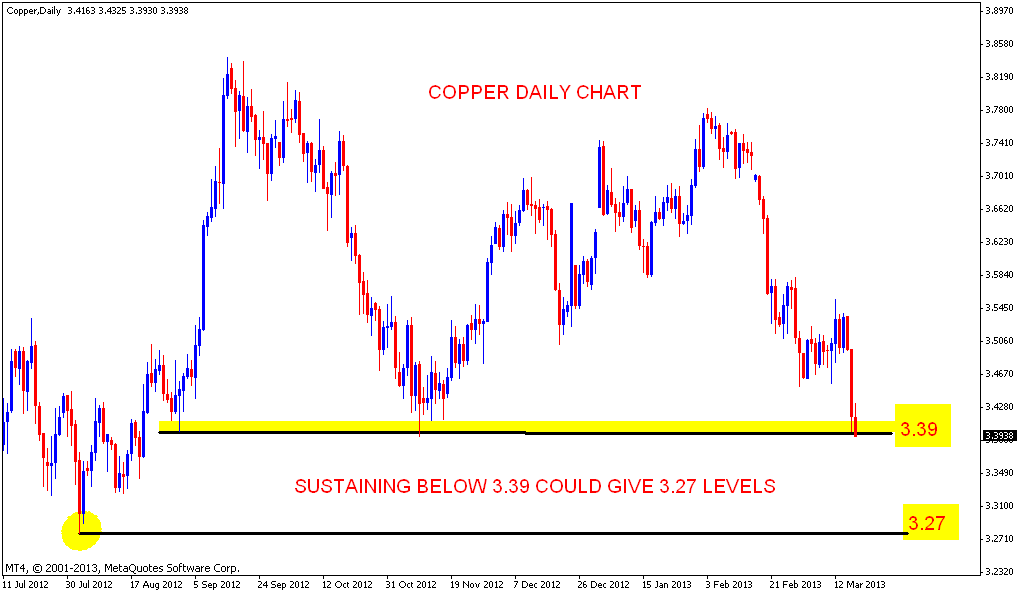
- Copper has broken the support line of the weekly triangle pattern.
- Daily chart shows price testing crucial support level.
- Sustaining below 3.39 levels may push price down towards 3.27 levels.
- ES bulls need to break above 78.6 % Fib level and Hourly cloud to extend the up move.
- Broken channel support line is also acting as resistance.
- Unable to clear the above mentioned levels may lead to a correction.