- 4 Hour chart shows price testing crucial support line and 200 Period SMA for this time frame. Sustaining below this line or 2260 levels may extend the fall towards 2250 for the day. Strength here can take price back towards 2278 levels again.
- Levels in first two charts are crucial for bulls to hold to keep the bullish structure intact.
- RUSSELL 2000 BROADENING TOP
-->
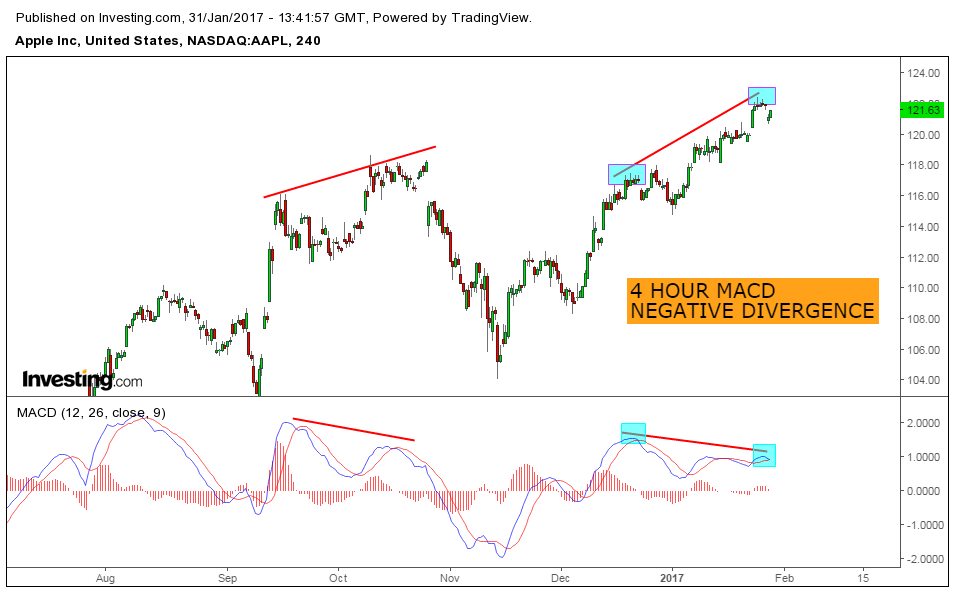
- Apple 4 Hour chart shows negative divergence.
- 2nd chart shows price testing resistance line in daily chart.
- Last chart is the 4 hour time frame again with a rising wedge kind of contraction.
-
ES Analysis before opening bell
-->
- Most crucial support line for ES is the 200 Period SMA shown in first chart. Close below this line will strengthen ES bears further.
- Cloud in 30 Minutes and 200 Hour SMA of 60 Minutes are immediate resistance levels. Bulls need to move above these levels to avoid bigger correction
- Immediate levels to resume weakness is 2267 and 2263 levels on the down side.
- ES Analysis after closing bell
-->
- The spike outside the rising wedge has failed.
- Price falling fast towards 50 Day SMA.
- Staying below 821 price likely to test 50 Day SMA.
- GOOGLE Analysis before Results
-->
- Falling price was stopped at the Triangle resistance line.
- Now 2272 and 20 Day SMA are crucial numbers for bears to close below.
- Many bulls got in after the Triangle breakout and above 2278 So If that breakout and 2278 becomes invalid many bulls would panic which can result in bigger falls.
- For that Scenario bears need to close below 2272 and 20 Day SMA till then Bulls are safe.
- GOLD Chart update
-->
- Gold 4 hour chart shows price bouncing back to the broken cloud and 100 Period SMA.
- Immediate strength and weakness levels are shown in one hour chart. Trading above 200 Period on closing basis may tilt the balance in favour of Gold bulls. Trading below 1190 will resume correction.
-->
- Nifty 15 Minutes nearing the cloud. When the trend is strong cloud in this time frame usually acts as support.
- One hour chart shows a Bearish candle at the top and the current move against the trend happening. Bulls will remain strong above 8600 levels.
- Last is the 5 minutes time frame which shows crucial levels for the Day.
- ICICI Bank Price Volume Action
-->
- Nifty month closing above or near November month candle high's will keep the bullishness intact. This can also complete a possible morning start pattern Although this is not the appropriate place for the pattern It shows further bullish possibility.
- But one warning for Bulls is the Overbought RSI in daily time frame. So further bullish bet from here would be risky one.
- ICICI Bank Price Volume increase before quarterly results.
-->
- Broadening Formations like this one especially in Higher time frames can be used to pick goo swing trades Instead of breakdown or breakout trades.
- In this case Price has hit the upper boundary of the pattern But there is a Bull Flag which is likely to take price towards the resistance line of Broadening formation again.
- For bears Immediate levels to watch out for weakness is 50 Day SMA and the low 133.17. close below 50 Day SMA should give some strength for Russell bears.
- SILVER Weekend Update
- GOLD Weekend update
- TESLA Weekend Update
- GOOGLE Weekend update
-->
- Silver daily chart shows previous support zone around 17.10 - 17.30 is acting as resistance.
- Weekly chart too shows 20 Week SMA acting as resistance.
- So the level for silver bulls to beat is 17.30 to extend the weekly bounce. Staying below this level may Tilt the balance in favour of Silver Bears again.
-
GOLD Weekend update
- TESLA Weekend Update
- GOOGLE Weekend update
-->
- TESLA Week shows possible targets for the current up move. Momentum Likely to carry stock towards 265 and 271 levels.
- Loss of momentum will be first visible in Hourly charts when price falls below the cloud. The current move started when price moved above the cloud at 189 continues to gain strength.
- GOLD Weekend update
- GOOGLE Weekend update
- Gold bears are at an Advantage for Now as price is staying below 4 hour cloud and 100 Period SMA.
- So the crucial resistance level for the current bounce is between 1197 - 1200. Selling at higher levels is safe if the bounce is up to that level. Anything above 1200 may tilt the Advantage in favour of Gold bulls.
- GOOGLE Weekend update
-->
- First chart shows the daily time frame testing the neck line of a possible bullish pattern. Staying above 271 levels should push the stock higher towards 280 and 285 levels.
- 2nd chart shows Price and Volume Advance. This is one of the biggest volume Days For ICICI Bank on a Bullish Day.
- But bulls should stay above 270 - 271 to keep the up ward momentum intact. Falling below this level is negative.
- GOOGLE Weekend update
-->
- Google has fallen back into the rising wedge pattern which is a bearish event
- Daily chart also shows price reacting bearishly from the resistance line.
- Now Google bears need to confirm this by breaking below 838. Further bearishness only if this level is broken on closing basis.
-->
- Price testing the resistance line
- 4 Hour chart shows a rising wedge kind of pattern Usually bearish But an upper breakout cannot be ruled out as well.
- Bearish Daily candle here may Help apple bears to do a reversal.
-
GOOGLE Rising wedge and resistance line
-->