Stock Market Chart Analysis
My blog Analyses the trend and patterns of stocks, Futures, Commodities and Forex Markets
January 31, 2017
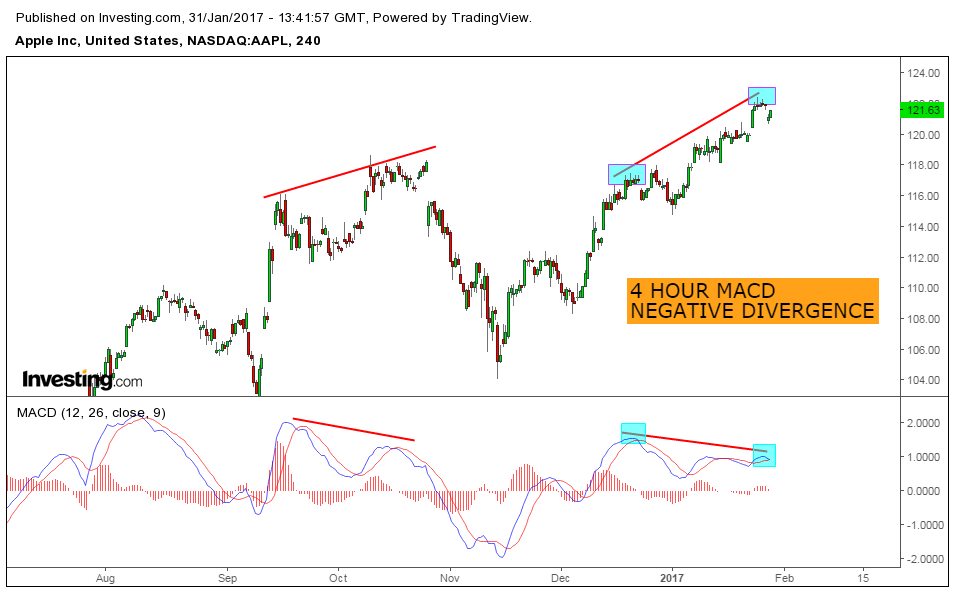
APPLE Chart analysis before results
Apple 4 Hour chart shows negative divergence.
2nd chart shows price testing resistance line in daily chart.
Last chart is the 4 hour time frame again with a rising wedge kind of contraction.
ES Analysis before opening bell
-->
No comments:
Post a Comment
Newer Post
Older Post
Home
Subscribe to:
Post Comments (Atom)


No comments:
Post a Comment