Stock Market Chart Analysis
My blog Analyses the trend and patterns of stocks, Futures, Commodities and Forex Markets
July 27, 2015
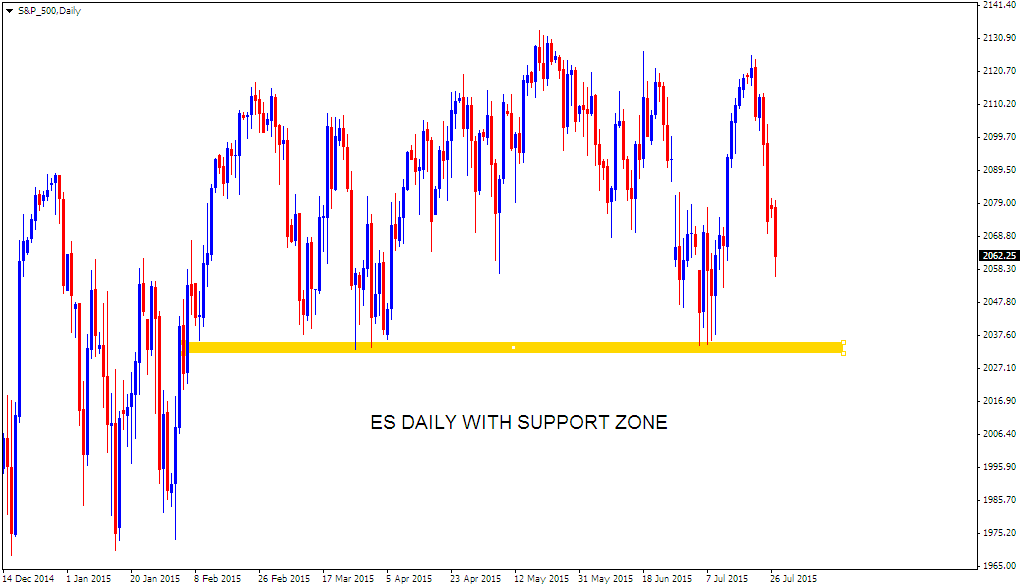
ES Chart analysis
ES One hour shows price trending below hourly cloud. But Daily and weekly charts are approaching crucial support levels.
50 Week SMA and previous support level in daily time frame may stop a bigger fall from happening.
Newer Posts
Older Posts
Home
Subscribe to:
Posts (Atom)