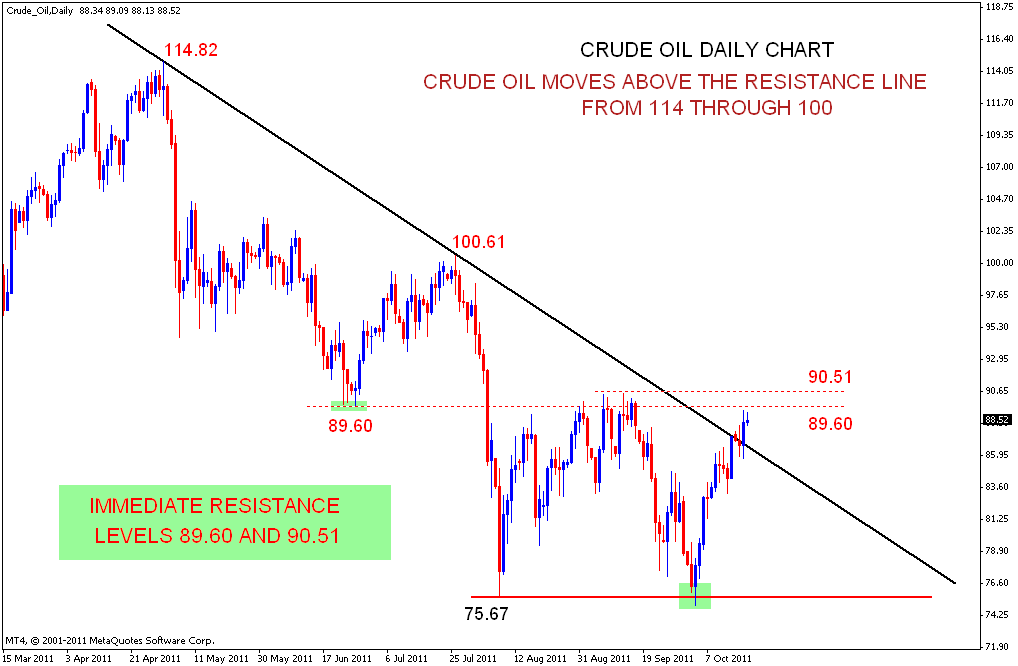
- Crude oil daily chart with resistance levels.
- Price has broken above the resistance line from 114 through 100 levels.
- Now the immediate resistance levels are 89.60 and 90.51. Daily candles closing above these levels may give an up move for crude oil.
- Getting resisted here will be negative for Crude Oil.
- ES Hour chart is trading in a broad range.
- Price is near the top of the range.
- If the breakout does not come we may see a pull back towards 50 Period SMA or the cloud of Four hour time frame.
- S&P 500 ANALYSIS AFTER CLOSING BELL
- Nifty is nearing the top of the range.
- Price is trading above 20 and 50 SMA in daily time frame which will favor bulls.
- Now for the current up move to continue 5169 has to be crossed on closing basis. Otherwise we may see correction from these levels.
- Reliance has stopped falling at 20 SMA.
- But daily chart indicators are suggesting some more downside.
- Bulls need not worry as long as 20 and 50 SMA give support.
- 20 SMA @ 810
- 50 SMA @ 796
- Support line drawn in 2nd chart too is important for bulls to hold on.
- S&P 500 ANALYSIS AFTER CLOSING BELL
- Month of SPX is trying to stay above 20 month SMA. Bulls will be comfortable to stay above 1200.
- Weekly candle is fighting with the resistance level 1219 - 1230. Closing above this level may take SPX towards 1250 level.
- Today's Move was resisted at 100 DAY SMA.
- It was also the top of Ichimoku cloud. So this area will act as a confluence of resistance. Closing above this level will add strength for this up move.