- EURUSD Continues to show weakness at 50 day SMA. Pair will remain weak below the daily cloud and most importantly pair is unable to make an attempt to move above 200 Day SMA.
- The golden ratio and Negative divergence gave good correction. Next hope for bulls is 50 Day SMA if not held on closing basis can give bigger falls.
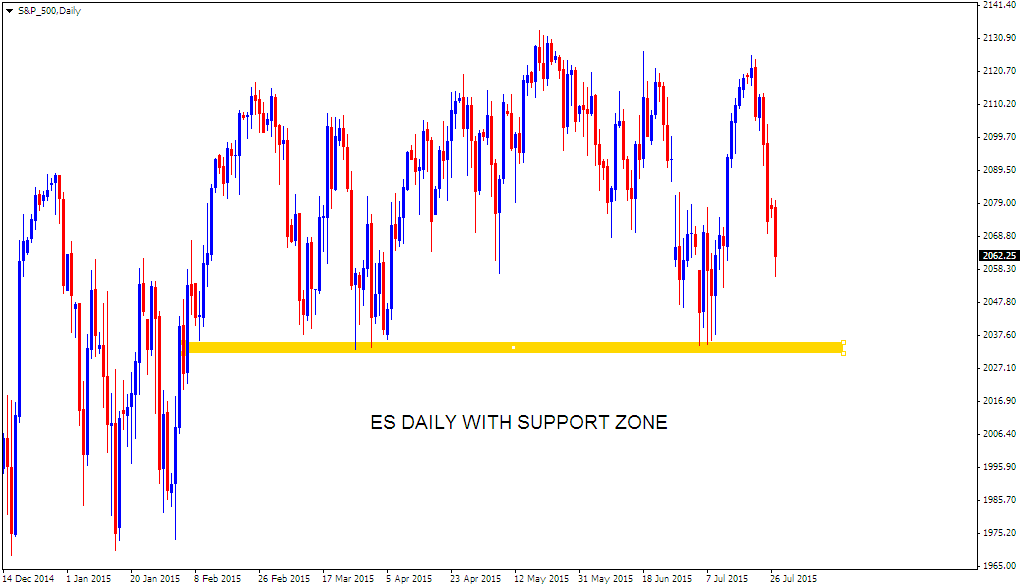
- ES One hour shows price trending below hourly cloud. But Daily and weekly charts are approaching crucial support levels.
- 50 Week SMA and previous support level in daily time frame may stop a bigger fall from happening.
- Nifty shows weakness at the Golden ratio. Negative divergence is there with price and RSI. Having said that price has to fall below 20 Day SMA and 23.6% Fib level for bigger correction to happen.
- ES nears 200 Day SMA. 4 Hour chart also shows previous resistance zone and Golden ratio which may act as support for a bounce. to happen. For now though price is not taking a pause. Doji candles at the above mentioned levels may arrest the fall of ES
- Immediate support for bank nifty at 20 Day SMA. Bears need a close below this level for bigger falls to start. Daily MACD is also suggesting weakness but price need to stay below 18600 levels.
- Weekly cloud continue to act as support. bigger weakness only on price closing into the weekly cloud.
-->
- Daily chart shows price moving towards the falling resistance line. Price seems to be moving in a large bearish descending triangle pattern. Within this bearish pattern price is in a bullish phase for now. Bullishness is likely to get weak near the falling resistance line.
- Nifty bears failed to take price below 20 Day SMA. Weakness only if price moves below the rising support line shown in first chart.
- Next hope for bears is the golden ratio shown in last chart. Bulls need to clear this for bigger up moves to follow.
- Correction seen after negative divergence with MACD Histogram and price. Chart 2 and 3 shows possible support zone which should be broken by bears to extend gains. Unable to move below 20 SMA should favour bulls.
- ES one hour testing the cloud.
- 4 Hour chart shows price pausing at previous resistance zone.
- Daily chart is out of the range But price is pausing near the recent high's. Weakness here may take price back into the daily range again.
- First chart shows how bulls avoided a Death cross from happening with a powerful reversal from 17174 level. This up move is still intact but price is showing signs of weakness which is not confirmed yet. Weakness is seen at the Golden ratio along with negative divergence in MACD Histogram.
- Bears need a daily close below 18860 levels for a possible extension of weakness.
- Bidu weekly tries to re-enter the bearish pattern from which price gave a breakdown.
- Daily can confirm a reversal only if price is able to sustain above the falling resistance line and 200 Day SMA. Bearishness near the down trend line may result in another fall.
- Last chart shown with the MACD Histogram shows Developing negative divergence. Price also near the Golden ratio for the fall from 9119 levels to 7940. First chart shows price hanging around a possible support resistance zone. So the current levels are crucial Break above it may give bigger up moves. More weakness here may result in correction towards 8300 and 8200 levels.
- Crude oil trading in a broad range and price trading on the bearish side of the range. But crude oil bulls are looking at possible support in golden ratio shown in weekly time frame and the support zone in one hour chart.

- Price at recent swing low which may act as support.
- EURUSD Daily chart shows price at golden ratio. EURUSD Bulls need a reversal candle at this level to avoid bigger falls.
- Gold one hour chart shows triangle breakdown.
- Weekly is testing crucial support levels as shown in chart 2 and 3. Gold bears need a lower close for the weekly candle for bigger falls to happen. Good up move possible if price finds support at the current levels.
-
GOLD Hourly Triangle
-->
- Gold daily is near crucial support zone.
- 4 Hour chart is acting as resistance. For a bounce to happen price needs to stay above this cloud..
- One hour chart shows a triangle pattern. breakout from this pattern may give bigger direction for gold.