- SP 500 has given another bullish formation in 5 minutes this time.
- Bullish pennant has given a break out.
- Although the pennant is not a perfect one. This will be positive for the bulls. As the break out will help the triangle break out in the larger time frame.
My blog Analyses the trend and patterns of stocks, Futures, Commodities and Forex Markets
June 3, 2010
SP 500 PENNANT IN 5 MINUTES CHART
DOW JONES RISING WEDGE AND TRIANGLE
- The fight between bulls and bears are clearly visible in the charts.
- Bulls trying to keep the triangle intact
- Bears want the rising wedge to break down the bottom trend line.
- Lets see who wins at last. My personal view is that the triangle will win at last.
- Caution i may go wrong so have stop loss.
DOW JONES TRIANGLE DOING A CLASSIC RETEST
- DOW JONES which broke out of a triangle might do a classic retest of the trend line before making moving up again.
- 10200 should also act as good support.
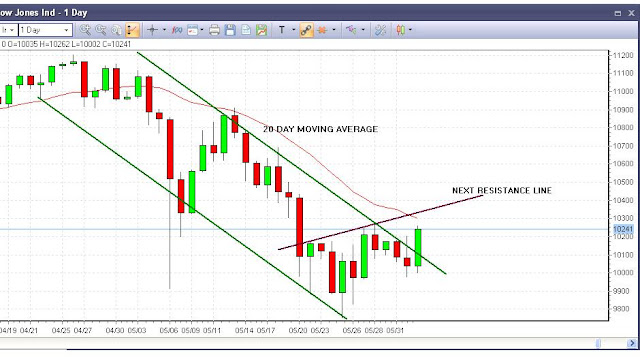
DOW JONES RESISTANCE LINE IN DAILY CHART
- Dow jones has resistance around 10350 for today.
- The resistance line should be broken for any upside targets to unfold from here.
- If the index starts to trade above the 20 day SMA it should cross the resistance without any problems
MICROSOFT HAS GOOD SUPPORT AT 24
- As i have shown in the previous post of microsoft, The stock has good support at 24
- Now it has taken support at 24 and it is now targetting it's 20 day moving average.
- If MACD gives a buy signal the stock may go above its 20 day moving average.
- So a buy in this stock is advised with a stop loss of 24.
AMGEN CO(AMGN) HIGH VOLUME BREAK OUT
- Amgen co has given a high volume break out.
- Trading above yesterday's close the stock should achieve 61 easily.
- Price has closed above 5 day EMA and 20 day SMA.
Thank you
NIFTY LINE CHART SHOWING SUPPORT FOR BULLS
- Nifty hour chart showing a support band between 5080-5089.
- As long as nifty trades above this band today bulls are safe.
thank you
RENUKA SUGARS LTD NEGATIVE DIVERGENCE
- RENUKA SUGARS LTD is showing negative divergence in hourly chart.
- Breach of the trend line will be warning for the bulls. If the trend line is not breached one can hold on to the buy call.
- Renuka Sugars gave a break out recently CLICK HERE TO SEE IT
Thank you
HANG SENG TRADING ABOVE 20 DAY MOVING AVERAGE
- Hang seng index having broken a major trend line is trading above its 20 day moving average.
- The index may move up till it's 50 day moving average.
- So the strength in asian markets like hang seng may help nifty continue its upward journey.
thank you
NIFTY FIBO LEVELS WITH EXTENSION TARGETS
- Nifty Fibonacci levels in hourly chart with extension target of 5180.
- If nifty manages to close above the resistance line mentioned in the chart. The target of 5180 is possible.
- Again another Fibonacci Magic look were the extension target is mentioned at the triple top area.
GAP ANALYSIS IN HOURLY CHART
- Some time a gap which is left unfilled may suggest you of a short term reversal.
- See how all the gaps are filled but the one gap at the bottom of this chart is not yet filled.
thank you
NIFTY IS TRADING NEAR RESISTANCE
- NIFTY IS TRADING NEAR IT'S RESISTANCE AREA
- ANY UPSIDE POSSIBILITIES ONLY AFTER BREAK OUT OF THIS RESISTANCE
THANK YOU
DOW JONES ANALYSIS AFTER CLOSING BELL
- Dow Jones has given a triangle break out. If this one is not a false break out the target is more than 10700.
- But for now The channel break out is were we have to concentrate. This is the first time a bullish candle has closed outside the channel in 32 days .
- The 20 day SMA is not captured yet. A successful close above this moving average.
- The 20 day SMA and 5 day EMA crossover has not yet done yet. MACD crossover is also not done yet.
- IF both the crossovers is done that can be confirmation of a successful triangle break out.
thank you
SP 500 END OF DAY ANALYSIS FOR JUNE SECOND
- SP 500 Index has closed on a positive note.
- This is the second attempt of reversal from this channel.
- First time it was failed and resistance was just below the 20 day moving average
- 2nd time the index has closed below 20 day SMA. But this time the reversal may happend
- If you are a moving average crossover trader, I have plotter the 5 day EMA and the 20 day SMA the crossover has not yet done. One can also combine the MACD crossover to make it a better entry. Both the crossovers are yet to happen.
THANK YOU
RUSSELL 2000 INDEX BULLISH FLAG BREAK OUT
- RUSSELL 2000 INDEX HAS GIVEN A BREAK OUT.
- NOW BEFORE YOU JUMP TO GO LONG. KEEP STOP LOSS JUST BELOW THE BREAK OUT POINT.
- BECAUSE I SAW SOME PATTERNS IN ASIAN MARKETS WHICH GAVE FALSE BREAK OUTS.
- THIS BREAK OUT CAN TARGET 670.
THANK YOU
Subscribe to:
Comments (Atom)


