- Facebook one hour chart getting support at the small gap and golden ratio shown in chart one and two.
- Immediate resistance level at 50 Hour SMA.
- Breaking these levels on closing basis may result in a bigger move.
- Apple hour chart is getting ready for a bearish cross with 20 and 50 Hour SMA.
- Crucial levels to break are 450 and 23.6% Fib level.
- Strength on price closing above 465 level.

- Silver shows a small inverted head and shoulders pattern in 30 Minutes chart.
- Sustaining above the resistance levels shown in chart 2 may lead to a bigger up move.
- Weakness on falling below 23.44 levels.
- Gold 30 Minutes chart shows resistance at 50 period SMA and 30 Minutes cloud. Sustaining above these levels may result in an up move.
- For a bigger up move price must sustain above 1441 levels as shown in the one hour chart.
- USO WEEKEND UPDATE
- APPLE WEEKEND UPDATE
-->
- SBI One hour chart shows price contraction.
- 15 Minutes chart shows a small triangle within the larger pattern shown in one hour chart. Breakout from the smaller pattern may give direction for the bigger pattern.
- Reliance capital at multiple resistance levels.
- For the up move to continue price must break 50 and 100 Week SMA. Price is also near the 38.2% Fib level.
- Above 387 price may target the 200 Day SMA at 397. Weakness below 371. Up move will weaken if price starts to trade below 351 and 347 levels.

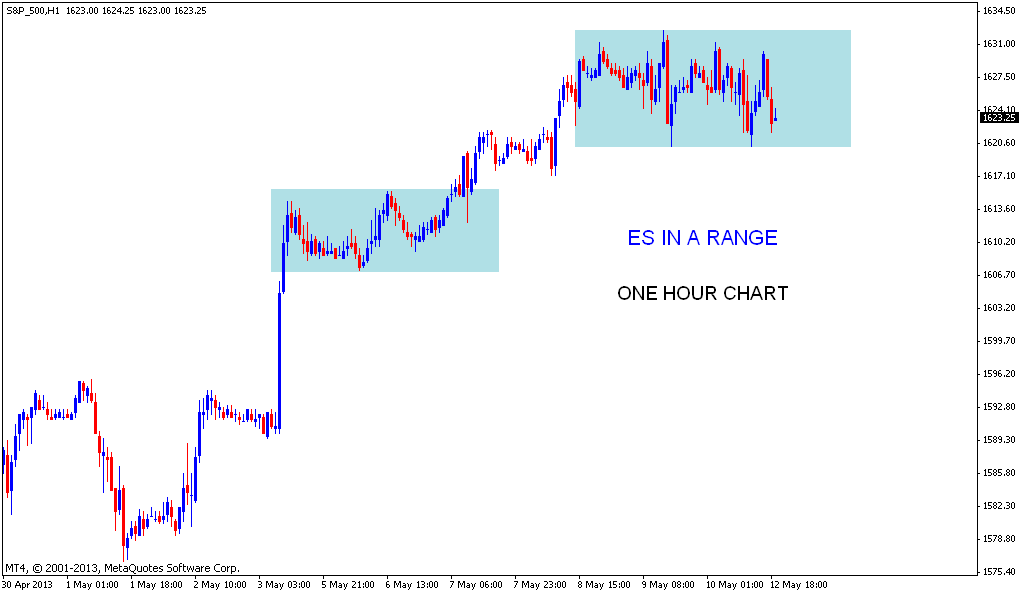
- ES near Hourly range bottom and also testing crucial supports like 100 Hour SMA and Hourly ichimoku cloud.
- Breaking or closing below the range low may result in a bigger correction.
- USO WEEKEND UPDATE
- APPLE WEEKEND UPDATE
-->