- Apple daily shows an Ascending broadening wedge pattern. This is mostly a bearish pattern. Daily MACD is showing Negative divergence with price.
- But bulls are seeing price above crucial moving averages. 20 SMA is above 50 Day SMA. Weakness in this setup only if price starts to close below 143 levels.
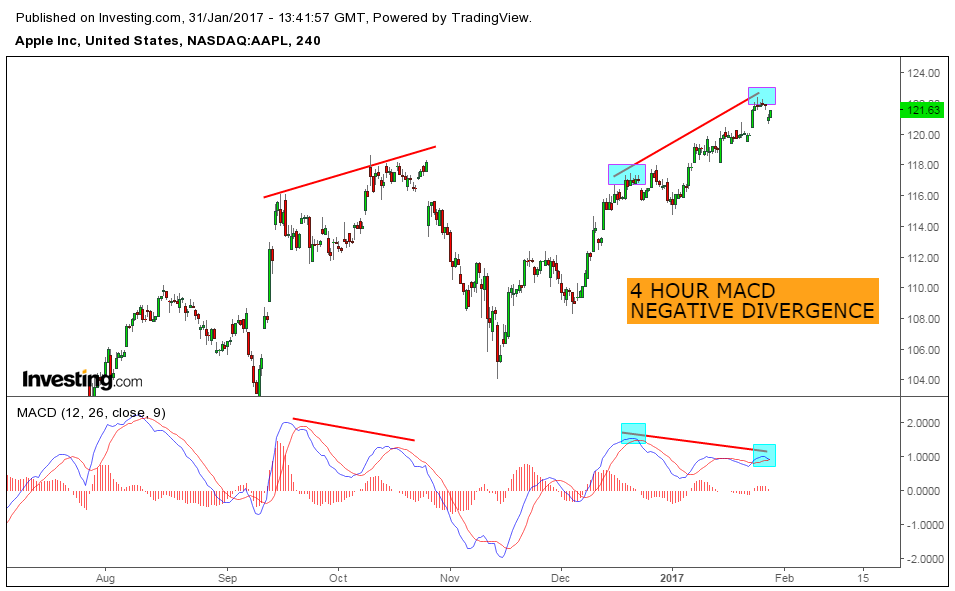
- Apple 4 Hour chart shows negative divergence.
- 2nd chart shows price testing resistance line in daily chart.
- Last chart is the 4 hour time frame again with a rising wedge kind of contraction.
-
ES Analysis before opening bell
-->
- Price testing the resistance line
- 4 Hour chart shows a rising wedge kind of pattern Usually bearish But an upper breakout cannot be ruled out as well.
- Bearish Daily candle here may Help apple bears to do a reversal.
-
GOOGLE Rising wedge and resistance line
-->
- Apple daily chart is moving towards a resistance line.
- Price yet to hit the upper resistance line. Weakness from the resistance line and breaking the rising support line may take price towards 110 levels.
- But the Larger time frame is looking bullish for now. If month sustains above 121 then another visit to 133 levels are possible in the Medium term.
-->
- Apple daily testing 50 Day SMA line which may act as resistance. At the same time 4 Hour chart shows a bullish cup and handle like pattern which is Bullish.
- So crucial levels are 112.50 on the upside and 111.50 as support zone.
- GOLD Pausing at Golden Ratio
-->
- Bears of AAPL need the stock to dip below 364 and the last swing low which is 353.
- Bulls will be safe as long as they stay above 20 week moving average as shown in 2nd chart
- Bulls can extend profit if they are able to close above 20 Day Moving average.
- Bears need 20 DMA to act as resistance.
- USO RISING TO THE BREAKDOWN LEVEL
- AAPL and GOOG Daily chart is trading above 50 Day Moving average.
- If this Moving average holds we might see good up move for these stocks.
- Good correction if 50 DMA gets broken on closing basis.
- GOLD CHANNEL VIOLATED
- AAPL is moving towards its 50 DMA.
- 362 is also an important support level.
- For bears price should close below 362 and 50 Day Moving Average.
- Getting support at these levels by not breaking 50 DMA will favor bulls of AAPL.
- AAPL has faded the earnings GAP.
- Price is trading below the GAP and if price continue to sustain below 50 hour moving average correction may extend.
- Price may hit 368 which is the 38.2% Fib level
- Apple is testing its 50 hour moving average.
- Price has taken support at the cloud as shown in second chart.
- Hour chart is showing a GAP between 378 - 384
- So price may get attracted to this GAP.
- Larger correction will be possible only if price close below the cloud.
- AAPL Sailing smooth above the cloud.
- Price yet to challenge 50 Hour moving average after 330 levels.
- MACD is showing some exhaustion in price But this has to be confirmed by price by breaking the short term trend lines.