
- The Month time frame is shown with Fibonacci levels. It shows a broad range between 38.2% and Golden ratio. So this is roughly between 74 - 77 to 103 - 112. Price right now is testing the bottom of this range.
- Second chart is the weekly time frame with possible support levels.
- Ichimoku cloud of Daily Time Frame will act as shield for Crude oil bears.
- 4 Hour time frame shows a bearish Descending triangle pattern. Mostly acts as a trend continuation pattern.
- Crude oil bulls must hope for a Basing formation around 74 - 77 for a possible up move to happen.
- EURUSD Trend Update
- SILVER TREND UPDATE
-->
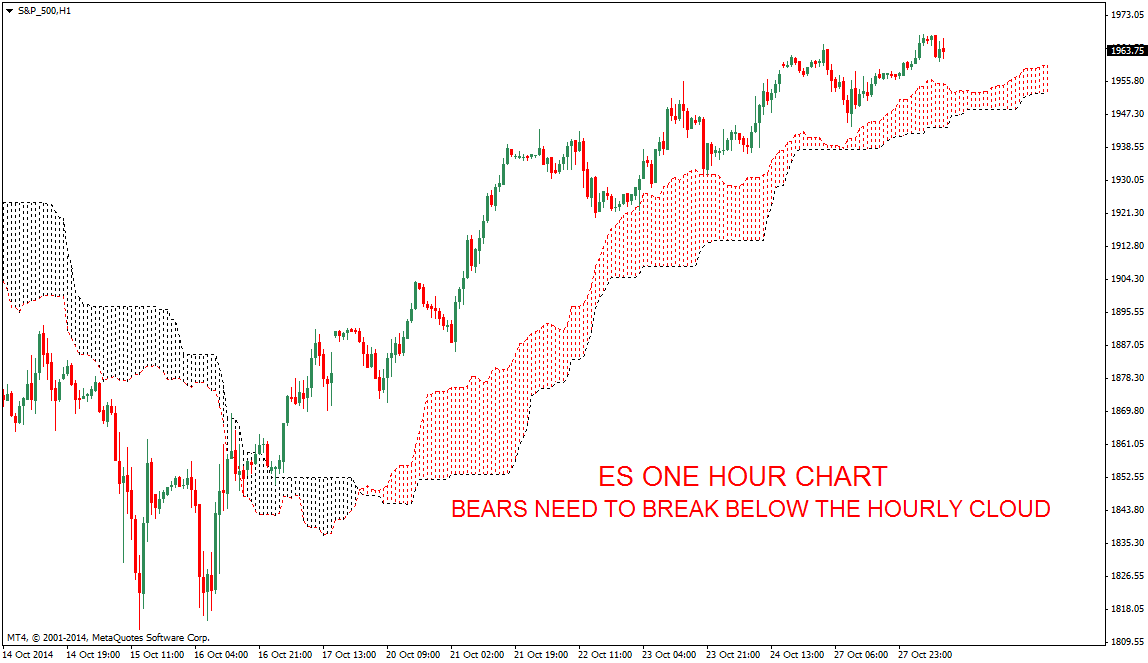
- ES Higher time frames are showing price at a crucial support resistance zone.
- Hourly charts are showing a nice trending move favoring bulls, That may end if the daily TF Fails to make a bullish close above 50 Day SMA. First chart also shows price testing a crucial support resistance zone.
- For the very short term price must stay above the Hourly cloud for bulls to extend this up move.
- EURUSD Trend Update


