My blog Analyses the trend and patterns of stocks, Futures, Commodities and Forex Markets
January 20, 2012
IBM Chart Analysis
- IBM is getting support near 200 SMA.
- Price if closes above 20 Day SMA should favor bulls for the coming weeks.
- Weekly chart is staying below Middle bollinger band for now. Today's weekly close should give good direction for the coming weeks.
- Long term up trend looks safe above the weekly cloud.
- ES CHANNEL UPDATE
ES Channel update
- ES sustaining near channel resistance.
- Price yet to violate channel resistance.
- Breaking today's low may trigger a correction towards 50 Day SMA.
- S&P 500 ANALYSIS AFTER CLOSING BELL
COPPER Previous support as resistance
- Copper getting resisted at a previous support level.
- Daily candle closing below this level will favor a bearish trade.
- Price is testing 50% Fib level, Bears of copper need price to sustain below this level.
- S&P 500 ANALYSIS AFTER CLOSING BELL
SBI Bullish price action with Decreasing volume
- SBI Daily chart shows an up move with low volume.
- Weekly charts are approaching resistance levels.
- From 38.2% Fib level towards 1960. If price breakout and close above this level with good volumes then this up move will continue. Any bearish action near this level with high volume will lead to a reversal.
- One thing that's favoring bulls is the price action, Till now price is not showing any weakness.
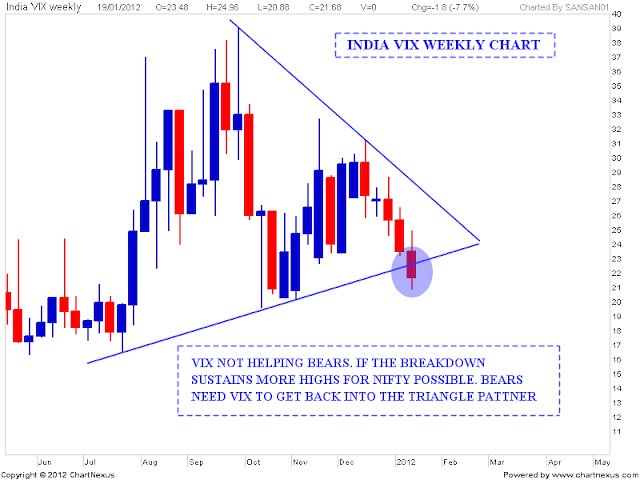
- NIFTY AND INDIA VIX UPDATE
NIFTY and India Vix Analysis
- VIX has given a triangle breakdown. If it sustains we may see further up moves in nifty.
- Price is approaching golden ratio for the fall from 5399 - 4531 which is an important level for bears.
- Last swing high which was 5099 and Golden ratio should be the level to watch out for possible weakness in price.
- S&P 500 NEAR RESISTANCE LINE
- US DOLLAR ANALYSIS
S&P 500 Analysis after closing bell
- Resistance line shown in Month chart is about 10 - 15 points away from the resistance line and daily chart is almost there.
- The up move continues with negative divergence. Price yet to show any weakness though. May be when price hits the resistance lines in daily or the month charts shown there will be a reaction for the negative divergences that's happening.
- US DOLLAR FALLING TO THE TREND LINE
Subscribe to:
Comments (Atom)


