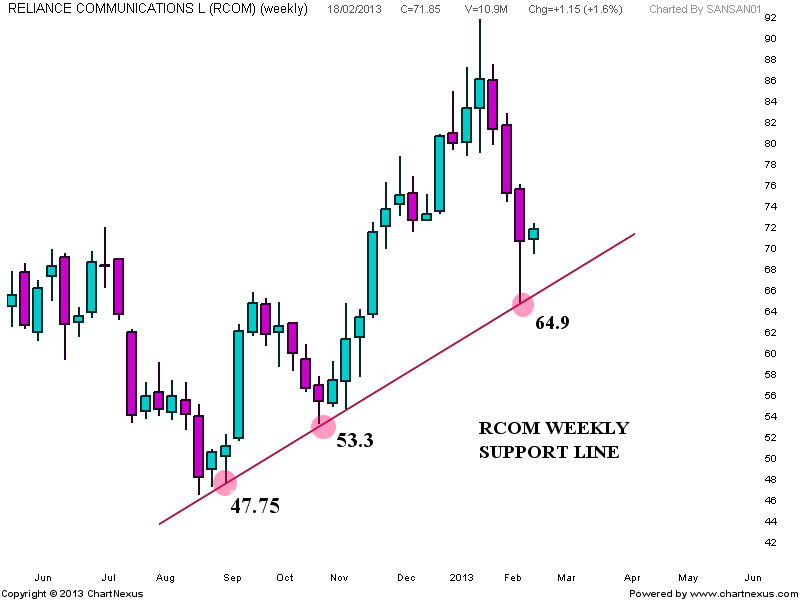


- First chart of RCOM shows price trying to hold above the weekly rising support line.
- Second chart shows price trying to hold above 200 Day SMA. Here price has also formed a bullish engulfing pattern.
- Sustaining above the falling resistance line could result in a long trade towards 79 levels. For bears need a close below 200 SMA to invalidate this bullish setup.
No comments:
Post a Comment