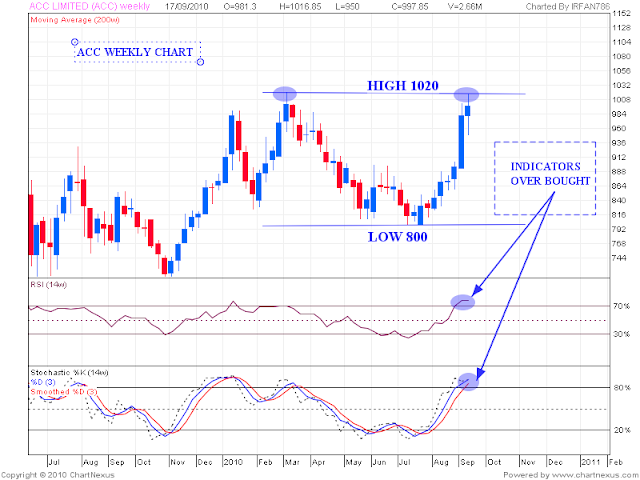
- ACC Weekly chart is showing resistance at 1020.
- Stock is trading in a broad range of 800 - 1020. Now the stock is trading near the upper end. If it does not move above 1020 during next week it can give a good shorting opportunity.
- If the stock breaks out above 1020 current up move can continue for some more time.
- Indicators such as RSI and STOCHASTIC are in overbought zone.

Dear San,
ReplyDeleteThanks for the nice analysis.
Regards,
Veer
Thanx Veer
ReplyDelete