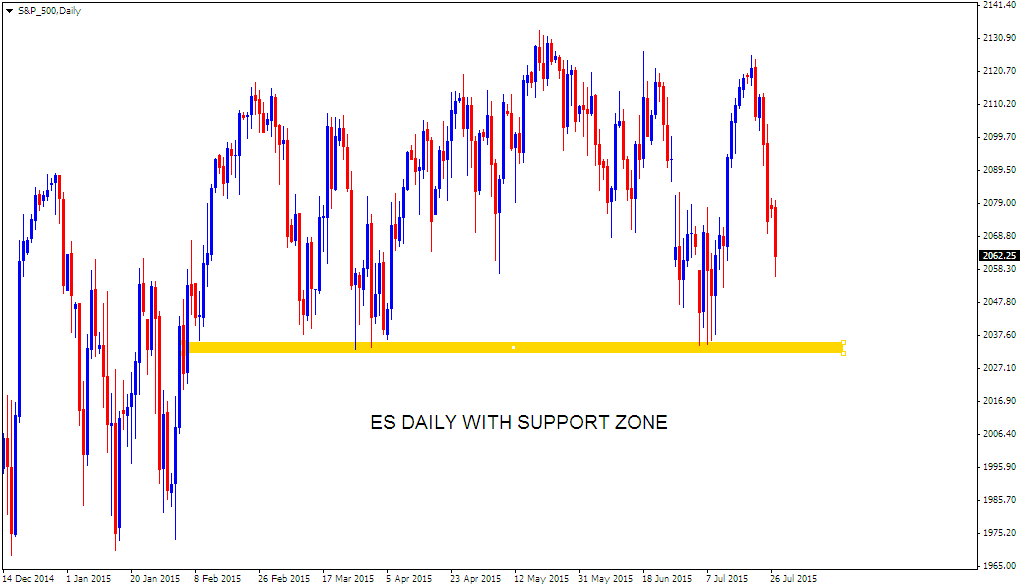
- ES One hour shows price trending below hourly cloud. But Daily and weekly charts are approaching crucial support levels.
- 50 Week SMA and previous support level in daily time frame may stop a bigger fall from happening.
- Nifty shows weakness at the Golden ratio. Negative divergence is there with price and RSI. Having said that price has to fall below 20 Day SMA and 23.6% Fib level for bigger correction to happen.
- ES nears 200 Day SMA. 4 Hour chart also shows previous resistance zone and Golden ratio which may act as support for a bounce. to happen. For now though price is not taking a pause. Doji candles at the above mentioned levels may arrest the fall of ES
- Immediate support for bank nifty at 20 Day SMA. Bears need a close below this level for bigger falls to start. Daily MACD is also suggesting weakness but price need to stay below 18600 levels.
- Weekly cloud continue to act as support. bigger weakness only on price closing into the weekly cloud.
-->
- Daily chart shows price moving towards the falling resistance line. Price seems to be moving in a large bearish descending triangle pattern. Within this bearish pattern price is in a bullish phase for now. Bullishness is likely to get weak near the falling resistance line.
- Nifty bears failed to take price below 20 Day SMA. Weakness only if price moves below the rising support line shown in first chart.
- Next hope for bears is the golden ratio shown in last chart. Bulls need to clear this for bigger up moves to follow.
- Correction seen after negative divergence with MACD Histogram and price. Chart 2 and 3 shows possible support zone which should be broken by bears to extend gains. Unable to move below 20 SMA should favour bulls.