- Silver bulls trying to stay above the triangle support line. Bulls need to close above 200 SMA for bigger bounce to happen
-->
- The ascending wedge was discussed long back. Since price has broken the support line i wanted to share the possible target on the downside. Bullowski in his pattern site has discussed in detail about this formation. The target shown above is based on his research.
- Death cross is there,
- Bulls are seeing some reversal possibilities or dead cat bounce possibilities i should say which are shown in chart 3 and 4 As long as price stays below 200 SMA its dead cat. Above analysis without today's price action.
-->
- Silver week continues to be weak near the cloud. Major trend continues to favour silver bears.
- Daily chart shows price near a possible support line, If held an up move is possible. This one looks like a failed triangle breakout. Failed breakouts tend to give bigger moves in the opposite direction if the support levels are not held.
- 4 Hour chart shows price testing a resistance zone. Daily chart has finished a bullish Golden cross. 50 has moved above 200 Day SMA. For now though price is struggling to cross the resistance zone as shown in chart 2. Weakness gets confirmed if price stays below One hour lco
- Rising support line and 50,100 SMA are crucial support levels.
- Resistance at 200 SMA
- Price is in contraction between these levels. Closing above or below these levels may give bigger direction.
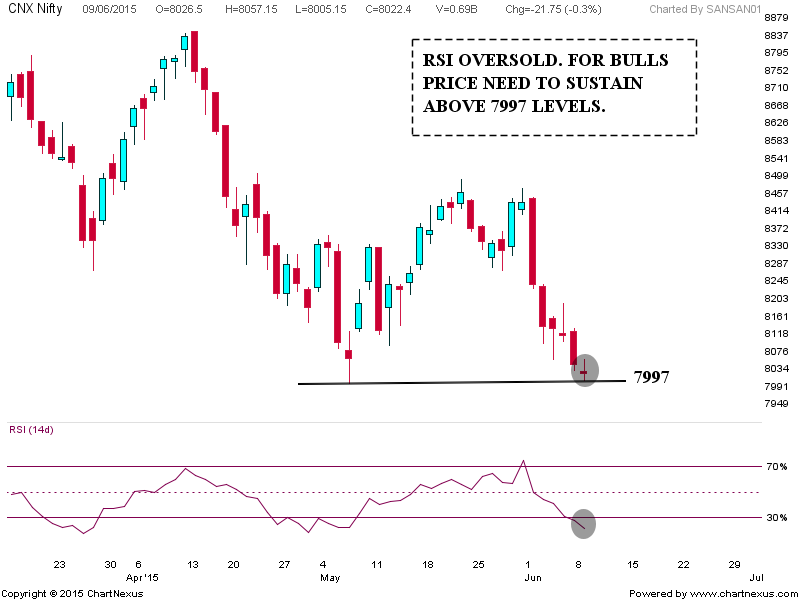
- Recent swing low getting tested. Only good thing for bulls here is the oversold RSI, But the month chart is looking bad for them as price is testing may month low. Day's or weeks closing below this zone will add strength for bears. Bulls with the help of oversold RSI must move up soon from this zone to avoid a bigger breakdown.

- ES Daily chart shows bulls trying to take support near 200 SMA and Golden ratio.
- Hourly chart shows price continues to trade below the cloud. Bulls need price to move above the hourly cloud for a bigger bounce to happen. Unable to move above the cloud may resume the fall.