September 27, 2010

S&P 500 futures before opening bell

CHART-II
  • S&P 500 has made a negative break down in hour chart. Negative for the bulls.
  • Things are looking good for the bears as of now
CHART- I
  • S&P 500 Futures hour chart with a pennant formation.
  • When a pennant occurs in up trend it is called as a bullish continuation pattern.
  • The rules of the pattern suggests upside breakout from here. Let's wait and see how this one goes.
  • SPY WEEKEND UPDATE

Broken channel

  • The trend line of the broken channel acting as resistance.
  • Up move is possible only if NF comes back into the channel. Till then the broken area will act as resistance.

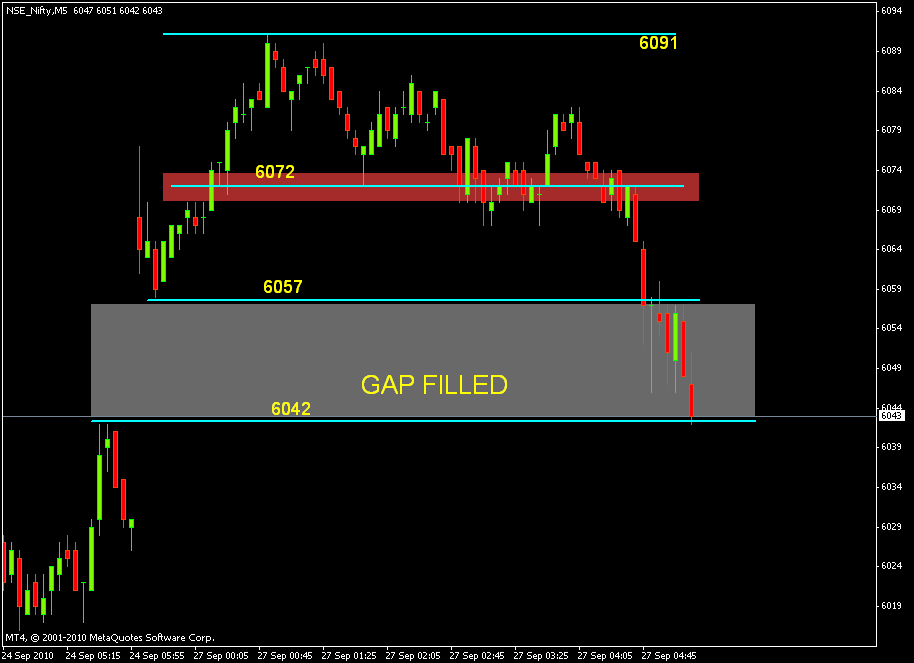
Nifty Intraday Update

CHART - II

  • An Up move is possible only if NF trades above 6057.
  • Trading below 6042 will be negative for the bulls.
CHART-I
  • NF is showing a high of 6091 and a low of 6058.
  • Below 6058 NF may try to fill the Gap.
  • Above 6072 NF will get closer to the day's high at 6091.

RELIANCE INDUSTRIES analysis

  • Reliance has given a spinning top near the support area of 993. If this level holds we may see a rally towards 1030.
  • The stock has also done a breakout above 50 DMA and a classic retest of the DMA, This should be followed by a rally to break the recent high made.
  • Above scenario possible only if Reliance trades above the range of 993 - 1007. Below 993 it will favour the bears.
  • INTRADAY LIVE CHART FOR RELIANCE INDUSTRIES

NIFTY climbing to the top

  • First chart shows Nifty's steady climb to the top. As i have said in the chart it seems the top or the destination is not yet reached.
  • Second chart shows the amount of profits someone would have made if he or she had decided to trail his position with 5 day low ema. As i said in the chart if 6037 breaks today, the meeting of nifty and 5 day low ema will get extended.
STOCK CHARTS POSTED DURING WEEKEND

September 26, 2010

Russell 2000 Weekend Update

  • Russell 2000 had good resistance at 670 region.
  • This area happens to be the 50% retrace level for the index.
  • On Friday the index made a good close above the 50% Fib level.
  • Now if the index manages to trade above 670 it should target 685 and 695 as targets.

AMAZON Breakout

UPDATED CHART
BELOW CHART POSTED ON 21ST SEPTEMBER
  • Amazon had good resistance at 151 as shown in the weekly chart.
  • It crossed the resistance on 21st of this month as shown in this POST.
  • Stock closes near its high last week. So the momentum can take the stock to more high's during next week.