October 28, 2014

S&P 500 Futures chart analysis


  • ES Higher time frames are showing price at a crucial support resistance zone.
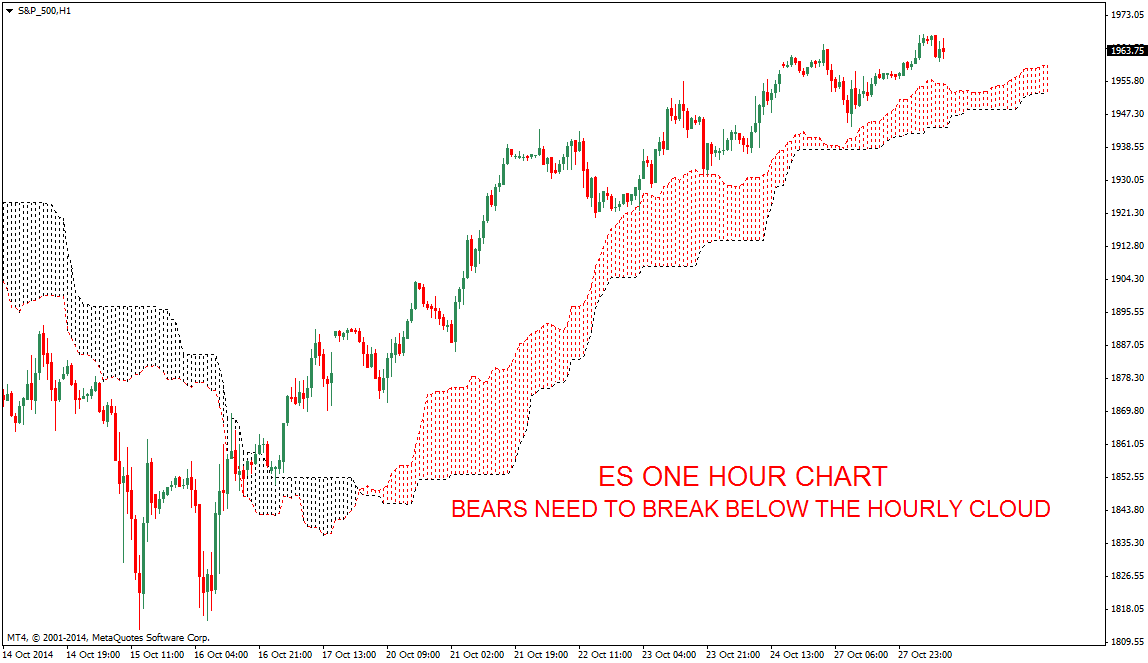
  • Hourly charts are showing a nice trending move favoring bulls, That may end if the daily TF Fails to make a bullish close above 50 Day SMA. First chart also shows price testing a crucial support resistance zone.
  • For the very short term price must stay above the Hourly cloud for bulls to extend this up move.
  • EURUSD Trend Update


October 27, 2014

SILVER Trend update

  • Silver Month week and Day time frames shows strong down trend.
  • Daily time frame will continue to favor bears as it stays below 50 and 200 Day SMA.
  • GOLD WEEKLY SUPPORT ZONE
-->


EURUSD Trend update


  • First chart shows the Monthly time frame which is near a support band between 1.20 - 1.25.
  • Weekly chart shows a Bearish flag breakdown with possible target of 1.20 levels. Weekly close below 1.20 will further extend the down trend.
  • Daily chart too shows the Ichimoku cloud as strong resistance. Any possible bounce only on price staying above the cloud.


October 14, 2014

GOLD Weekly support zone and Trend update

  • Gold Weekly chart shows price trying to find support near the 1180 levels. 
  • Daily chart is yet to clear 50 Day SMA. Unable to move above this level and 200 SMA may lead to further falls.
  • 4 Hour and One hour charts are trying to stay above the cloud. Price staying above 4 Hour cloud will give hope for Gold bulls.


September 18, 2014

GOLD Trend update

BACK AFTER A LONG BREAK. SHIFTED TO A NEW HOUSE. TOOK SOME TIME TO HAVE THINGS IN PLACE. STARTING OFF WITH THE GOLD CHART TODAY. HOPING TO UPDATE CHARTS REGULARLY AS BEFORE.
  • Gold is trading below crucial support levels like 1270 and 1240's.
  • Second chart shows price below crucial moving averages. Pressure on gold bulls till it stays below 20 SMA. Hope for a bigger pull back only if price moves above it.
  • 4 Hour chart too shows strong trend favoring gold bears.
-->


August 6, 2014

NIFTY Update after a Long Break

I AM SHIFTING TO A NEW HOUSE AND DEALING WITH PERSONAL ISSUES SO UNABLE
TO UPDATE CHARTS ON TIME. HOPING TO FINISH THE SHIFTING PROCESS IN A WEEK OR TWO AND WILL COME BACK TO REGULAR CHARTING.  


  • Nifty Bulls are trying to protect the crucial 50 Day SMA. 
  • Daily chart with MACD is showing negative divergence but price is yet to show any weakness.
  • Price yet to test the up trend line shown in chart 4. For bears price must break below the trend line, 50 day SMA and 7422 levels to confirm weakness.

July 11, 2014

ES Chart analysis


  • ES 4 hour chart testing 200 period SMA
  • Daily chart is testing the up trend line.
  • Price need to get back above the cloud of four hour time frame to avoid a bigger fall.