30 MINUTES CHART
4 HOUR CHART
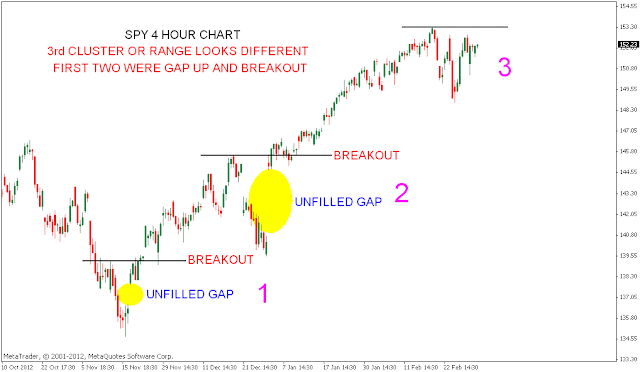
- SPY Ascending triangle breakout. Price gaped out of the pattern. If price does not test the gap before close we may have another runaway GAP. Second chart shows two other runaway gap's in chart which gave good up moves till now.
- Bears need price to close the gap and close the day back into the ascending triangle.
-->
- APPLE Monthly chart shows price below Middle Bollinger band If price continue to sustain below the resistance line stock may move towards Monthly Lower Bollinger Band.
- Weekly chart shows the crucial channel which can invalidate the above view if price gets out of it.
- Weekly price and MACD continues to show positive divergence without price confirmation of an up move instead price continues to give new lows.
- S&P 500 ANALYSIS AFTER CLOSING BELL
-->

- Crude oil testing daily trend line from 77 levels.
- Price also is bouncing from Golden ratio.
- Moving above 50 week SMA shown in last chart may give a big up move for crude oil. Unable to close the week above 50 Week SMA may result in a bigger fall towards 84 levels in the coming weeks.
- S&P 500 ANALYSIS AFTER CLOSING BELL
-->
- SPX 30 Minutes chart shows price closing at the neck line of Inverted head and shoulders pattern. Chart also shows resistance at 1530 level.
- Daily chart shows a possible broadening pattern. Bears need price to fall below 50 Day SMA which may give good falls from this pattern.
- Weekly chart shows no sell signal yet. Indicator staying above 80% line will continue to favor bulls of spx.
30 MINUTES CHART
4 HOUR CHART

- First chart shows 30 Minutes time frame with the Ascending triangle.
- Second chart analyses the current up move in 4 Hour time frame. Two runaway GAP's and good up moves followed. But current pullback looks different. That doesn't mean Bulls are not going to get a breakout But chances of a false breakout is likely. Two unfilled GAP's in chart too will keep the bears interested.
- APPLE CHART UPDATE
-->


