CHART-II
- ES could not move above the hourly cloud. Looks like the reversal attempt is about to fail.
CHART-I
- ES Four hour chart shows price testing 20 Period moving average. Bulls need price to close above this level for turning the trend.
- One hour chart shows price pausing at the Hourly cloud. Bulls need a cloud break to turn the trend in their favor. Failing to close above the cloud will be negative for bulls.
- This bounce was started from the Golden ratio in daily time frame So that level has to be held for a short term bottom to be in place.
- ES FIBONACCI LEVELS UPDATED
CHART-II
- ES has given a bounce from Golden ratio. Closing values can only decide if this is the short term bottom or not. So bulls need a higher close to confirm a turnaround.
CHART-I
- ES Daily chart shows price at the golden ratio. A pause candle here may show signs of a turnaround. Closing below this level will strengthen bears.
- Hour chart is yet to show a turnaround. Price is trending down safely below the cloud.
- Nifty hour chart is out of the channel
- Now price has to sustain above 4765 level for this up move to continue.
- Price staying below 4765 will keep the bears interested.
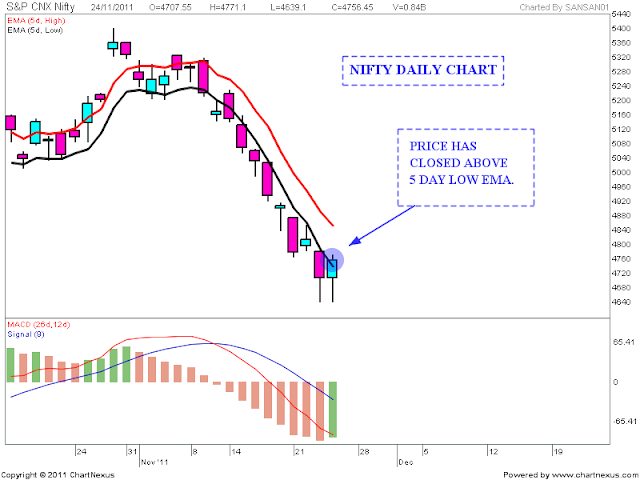
- Nifty closed above Day low EMA, But it is still below Week and Month Low EMA's.
- For bears price need to break below 4700 and the recent low(4639)
- Bulls need to sustain above Day low ema. Price closing below Day Low EMA will be negative.
- ES Four hour chart price trending down below 20 Hour SMA.
- Hour chart too shows strong down move below the ichimoku cloud.
- Every attempt to reverse the trend is being met with selling. There was an attempt to breakout by the bulls, But look how it went down without touching the cloud.
- MICROSOFT WEEKLY TRIANGLE UPDATED
- Silver hour is in a consolidation pattern getting ready for a breakout.
- Price in daily chart is showing support at 30.65 levels. Breaking below this level can give a good down move. On the up side price is struggling to close above 50 Day SMA. So an upper breakout may give good result only if it manage to stay above 50 Day SMA:


