- Month candle is bouncing from 20 Month SMA.
- A support line shown in weekly chart seems to be holding price from falling further. 50 Week SMA too is near this support line.
- If 50 Week SMA holds this bounce may extend till 20 Week SMA.
- Weekly MACD sell signal will come into play once more when this bounce looses momentum. further fall when 50 Week SMA Gets broken. Strength on a weekly close above 20 Week SMA.
My blog Analyses the trend and patterns of stocks, Futures, Commodities and Forex Markets
May 26, 2012
SPY Weekend update
BANK NIFTY Weekend update
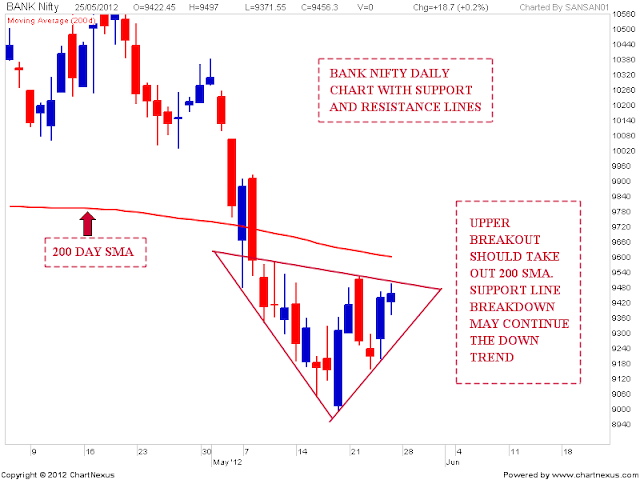
- Bank nifty has closed above 5 Day High EMA again. But daily chart is near a resistance line as shown in the second chart. Price need to get out of this pattern for moving ahead. An upper breakout should also take out the 200 Day SMA for a bigger up move to happen.
- Weekly chart shows price getting support near lower bollinger band and price closing above week low ema. Weekly resistance is near Ichimoku cloud. Price must enter the cloud for an up move to happen.
- Breakdown from the pattern shown in daily chart may continue the down trend.
Subscribe to:
Comments (Atom)


