- Gold chart shows falls of about 120 points. This is the third fall and price is yet to hit the channel support line. So Gold may give new lows before giving a bigger pullback
- First chart is the one hour time frame which shows price moving sideways in a range.
- 4 Hour chart shows price continue to breakout in favor of bulls sustaining above the up trend line.
- Ichimoku cloud of 4 Hour time frame also continue to look strong in favor of bulls.
- GLD WEEKEND UPDATE
- APPLE BEARISH CROSSES AN UPDATE
-->
15 MINUTES CHART
ONE HOUR CHART
- 15 Minutes chart shows a perfect intraday hammer reversal. Now price is approaching possible resistance at 5911 and 50% Fib level.
- Sustaining above 50% Fib level may lead to the Golden ratio and higher.
-->
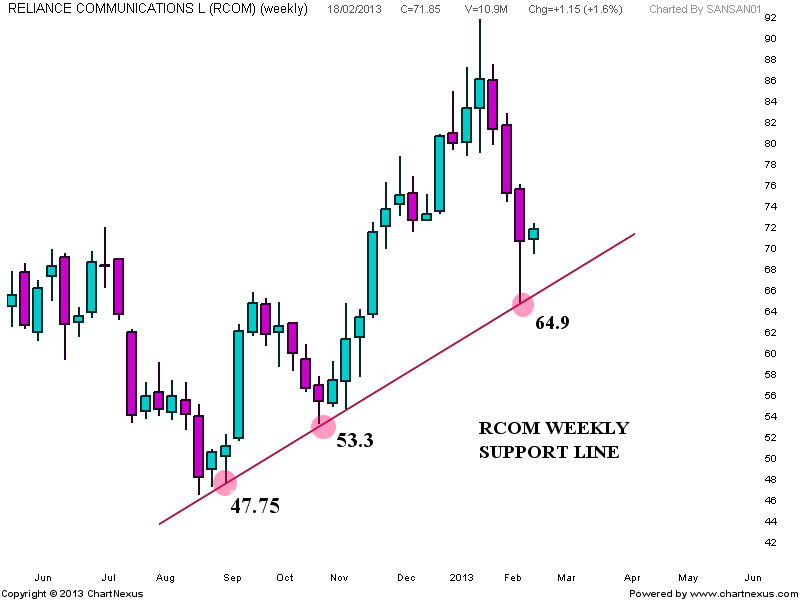
- First chart of RCOM shows price trying to hold above the weekly rising support line.
- Second chart shows price trying to hold above 200 Day SMA. Here price has also formed a bullish engulfing pattern.
- Sustaining above the falling resistance line could result in a long trade towards 79 levels. For bears need a close below 200 SMA to invalidate this bullish setup.
- First chart shows a bearish cross with 50 and 20 Day SMA. Price is finding resistance in the zone between 20 and 50 Day SMA.
- Death cross is also doing well so far. Price sustaining below 50 Day SMA will continue to help the death cross to perform well.
- Weekly chart also shows a bearish cross, Selling on rise into the above mentioned moving averages may continue to do well for apple bears.
- GLD WEEKEND UPDATE
-->