- Crude oil weekly Support line shows a bullish possibility. Bullish weekly close today could lead to an up move towards 96 levels.
- Daily chart is still below the bearish cross of 20 and 50. Bounce if restricted to 50 SMA will favor bears of crude oil.
- Gold bulls need to protect 1554 levels. Break below it could take price towards the crucial support zone in weekly chart between 1522 - 1531.
- Daily chart shows a clear down trend with price getting ready to give another breakdown.

- ES 4 Hour chart shows price continues to trade inside the range.
- Bulls getting support at 23.6% Fib level as shown in second chart.
- Last chart shows price testing hourly cloud. Bears need a cloud breakdown for a bigger fall to start. Price sustaining above the cloud may lead to a range breakout in favor of bulls.
-
S&P 500 ANALYSIS AFTER CLOSING BELL
-->
- Nifty testing a falling resistance line from 6111 levels.
- Price is also near the 50% Fib level as shown in the second chart.
- But price has closed below 20 and 100 Day SMA as shown in last chart. Holding above this level bulls may try to move up towards the golden ratio and 50 Day SMA.
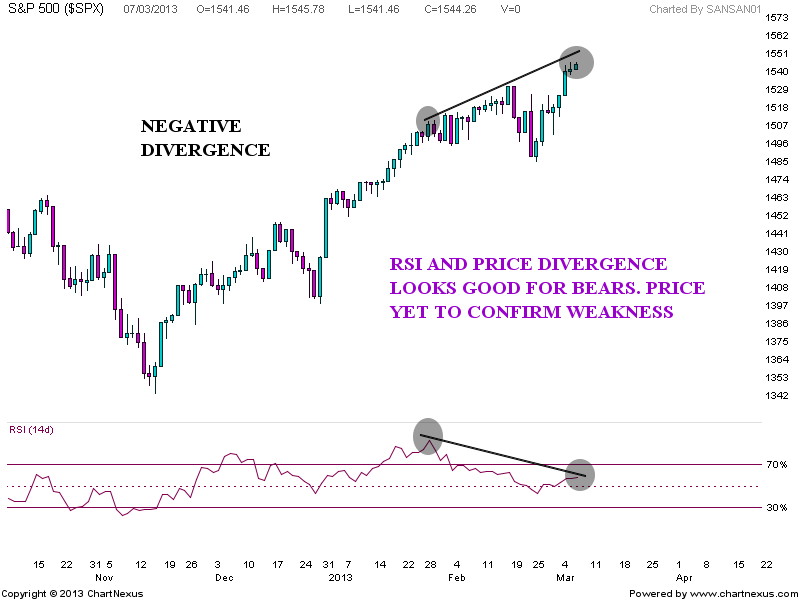
- SPX Daily chart shows a broadening pattern with price nearing the resistance line of the pattern.
- Price and RSI is showing good negative divergence setup for bears.
- Daily chart and weekly close will favor bears on a close below 1530 levels.
- GOOGLE DARK CLOUD COVER
-->
- Facebook daily chart shows price moving above 20 Day SMA. Bulls need a close above this level to extend the current up move.
- 4 Hour charts are shown with resistance levels. Fib levels shows 50% Fib level and previous support level may act as resistance.
- Price also testing 4 Hour cloud which may prevent a bigger up move from happening.
- Silver trying to form a a bottom formation in daily charts..
- Price getting resisted at 20 Day SMA. 38.2% fib level at previous support zone which may act as resistance.
- Immediate resistance levels at 29.04 and 29.41.
-->