My blog Analyses the trend and patterns of stocks, Futures, Commodities and Forex Markets
February 7, 2012
COPPER Near Support levels
- Copper four hour near support line.
- Price is also near 100 period sma.
- Breakdown below this level may target 3.64 levels in copper.
- Getting support here will target 3.86 level.
- SILVER SUPPORT LINES
SILVER Support lines
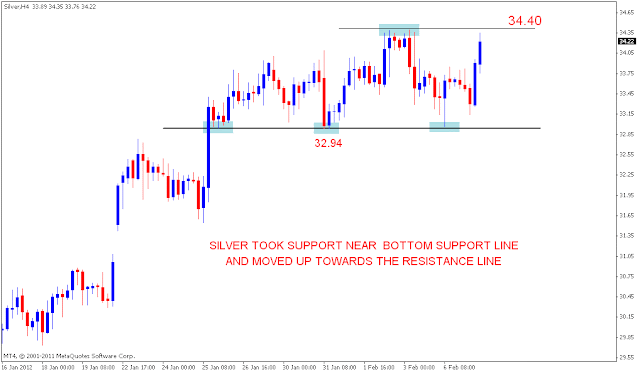
- Price took support at the support line shown in the below chart and is back near the resistance line of silver at 34.40.
CHART-I
- Silver four hour chart shown with up trend line and Horizontal support lines.
- Breakdown and close below 32.94 may target 31.55 levels.
- Getting support at 32.94 will result in an up move.
NIFTY Futures intraday update
CHART-II
CHART-I
- NF is not giving big corrections in favor of bears.
- Overbought indicators are giving sideways corrections followed by upper breakouts.
- Price continue to trend up above 50 Hour SMA as shown in 2nd chart.
- Breaking the up trend line shown in first chart may give a correction in favor of bears.
NIFTY Analysis
- Price nearing 50% Fib level for the fall from 6335 - 4531 and it is also near previous swing high of 5399. If these levels manage to stop bulls bears might get some relief. But MACD lines and moving averages continue to shows strength.
- USDINR CHART UPDATE
DOW JONES Analysis after closing bell
- Dow Jones still below weekly resistance level.
- Day is trading well above 20 Day SMA which will favor bulls.
- 30 Minutes chart shows with rising support levels which may also give a breakout above last week's high soon.
- Hope for bears only if they manage to break below 20 Day SMA. Trend will remain in favor of bulls as long as price stays above this sma.
GOLD Doji Week and Bearish Engulfing
- Gold weekly chart shows a Doji Candle.
- Daily chart has a bearish engulfing pattern.
- Bearishness of both these charts will be negated on a breakout above 1763 as shown in the last chart. Four hour chart also shows possible support at the cloud. Breaking below the cloud will extend the down move in Gold.
- EURUSD TREND UPDATE
Subscribe to:
Comments (Atom)


