

- Apple Daily chart has a death cross and if price remains below SMA bearish will stay stronger.
- Support zone or neck line for head and shoulders pattern is around 104 levels.
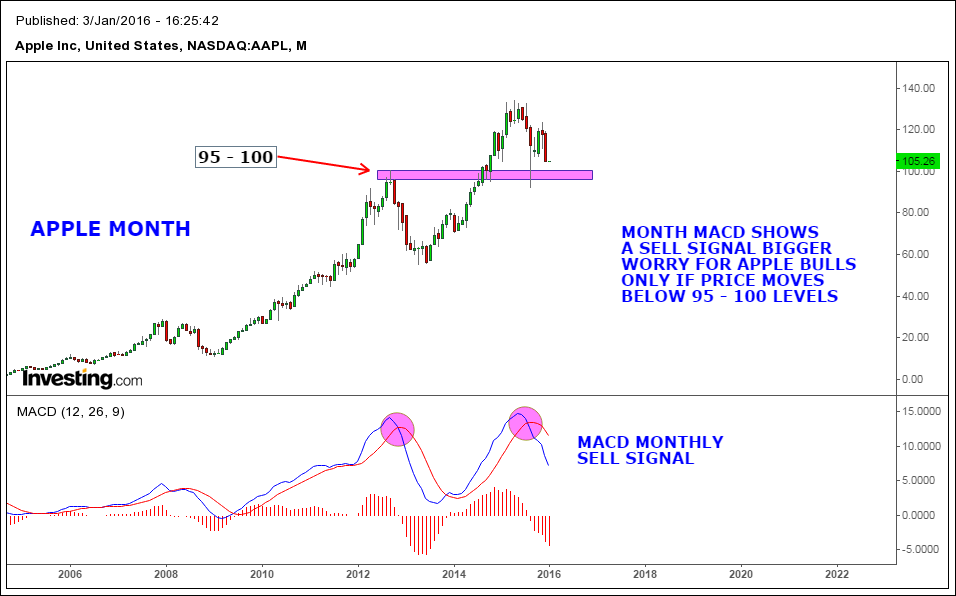
- Month chart too shows a sell signal in MACD indicator. Apple bulls will further weaken if price moves below 95 - 100 zone. This zone was previous resistance as shown in monthly chart and can act as strong support zone.