My blog Analyses the trend and patterns of stocks, Futures, Commodities and Forex Markets
December 9, 2011
ES Resistance levels
- ES is testing the broken rage and is likely to get resisted there.
- Price has also fallen below 50 period sma of four hour time frame. For bulls price has to get back above this level for an up move to happen. Price staying below 50 Period SMA of this time frame will help bears to extend gains.
- S&P 500 ANALYSIS AFTER CLOSING BELL
SILVER Analysis
- Price in daily chart is showing a contracting triangle pattern.
- Price is getting closer to the apex of the pattern.
- Being a triangle whipsaws are possible. So major moves will be possible only once the levels shown in the 2nd chart is taken out on closing basis.
- S&P 500 ANALYSIS AFTER CLOSING BELL
NIFTY Analysis
- Price has closed below 50 SMA. Next level for bears is the 20 SMA. Price closing below 20 SMA would swing momentum in favor of bears.
- Below 4900 - 4916 the GAP in daily chart may get faded.
- One shall also look for a close below day low EMA which will strengthen bears further.
- 20 SMA @ 4937
- 5 Day Low EMA @ 4935
- 50 Day SMA @ 5017
- S&P 500 EOD ANALYSIS
S&P 500 Analysis after closing bell
- Failed attempts to stay above 200 SMA has lead to a fall.
- Price is near weekly support levels, breaking below them would lead to a larger correction.
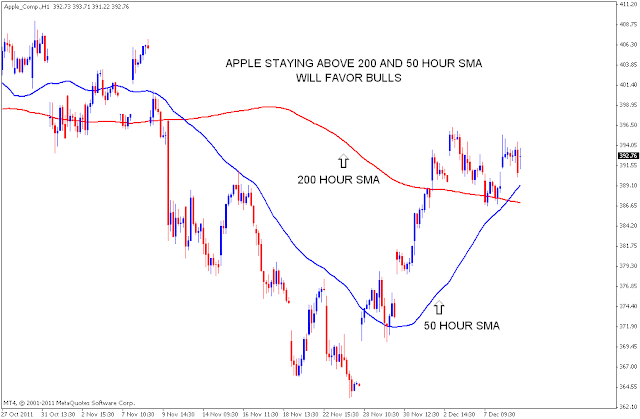
- Hour chart shows price testing 200 Hour moving average. Closing below it will extend correction. If price sustains above this level bullish structure will be intact.
Subscribe to:
Comments (Atom)


