September 19, 2010

EXXON MOBIL Corp Triangle in daily chart

DAILY CHART
DAILY CHART
  • Exxon Mobil Corp has a triangle in its daily chart.
  • Stock is trading near the upper trend line of the triangle.
  • Stock is trading in a small range within the triangle. Breaking of 61.6 means breaking out of the triangle. If the stock breaks the support at 60.37 price will slide to the lower end of the triangle.

AMAZON.COM Technical analysis

WEEKLY CHART
DAILY CHART WITH NEGATIVE DIVERGENCE
  • AMAZON is approaching its recent high of 151 shown in the weekly chart above.
  • Stock is also showing good negative divergence shown in the daily chart.
  • 151 may be tough to cross for the stock. If it manages to cross 151 another up move is possible. But negative divergence may not allow the stock to cross 151.

Unitech Near resistance line

  • Unitech is trading near an important resistance line.
  • The weekly chart suggests 91 as the resistance level which the stock is not able to cross. A successful close above 91 will be good for the bulls of unitech.  But for now the stock may hit resistance at this level and give a selling opportunity.
  • INTRADAY LIVE CHART FOR UNITECH

DLF Ltd Important Breakout

  • DLF weekly chart showing breakout above 345 levels.
  • For next week if the stock does not go below 341 - 347 area it has good chance of targeting 370 area. 

RELIANCE CAPITAL with an inverted head and shoulders

CHART - II
CHART - I
  • Reliance capital seems to be resisted by the neckline of an inverted head and shoulders
  • Resistance seems to be too strong at 825 region.
  • One should plot the neckline and can go long only if the neckline is broken. keep a small stop loss, The risk reward ration is good. A short sell is also possible next week if the attempt to breakout fails.
  • LIVE INTRADAY CHART FOR RELIANCE CAPITAL WITH EMA

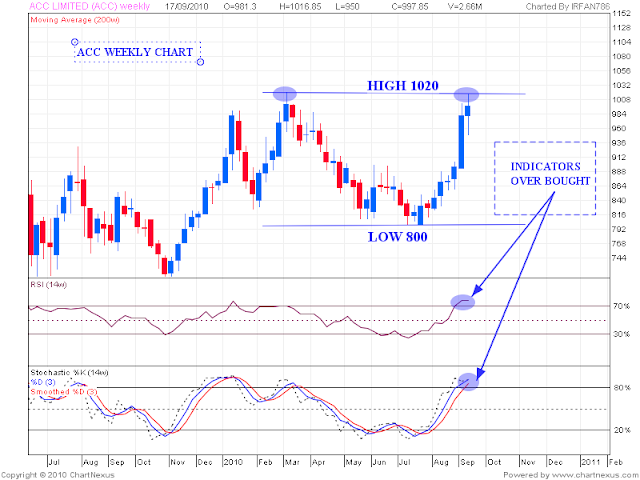
ACC Limited weekly chart analysis

  • ACC Weekly chart is showing resistance at 1020.
  • Stock is trading in a broad range of 800 - 1020. Now the stock is trading near the upper end. If it does not move above 1020 during next week it can give  a good shorting opportunity. 
  • If the stock breaks out above 1020 current up move can continue for some more time.
  • Indicators such  as RSI and STOCHASTIC are in overbought zone.

Russell 2000 Weekend Update

  • The resistance line marked in the line chart seems to be very strong. If the range in hour chart shown in this POST break on the upside, Index may find resistance at around 660 levels on closing basis.
  • Closing above this line can be very positive for the bulls.