- 4 Hour chart shows price testing crucial support line and 200 Period SMA for this time frame. Sustaining below this line or 2260 levels may extend the fall towards 2250 for the day. Strength here can take price back towards 2278 levels again.
- Levels in first two charts are crucial for bulls to hold to keep the bullish structure intact.
- RUSSELL 2000 BROADENING TOP
-->
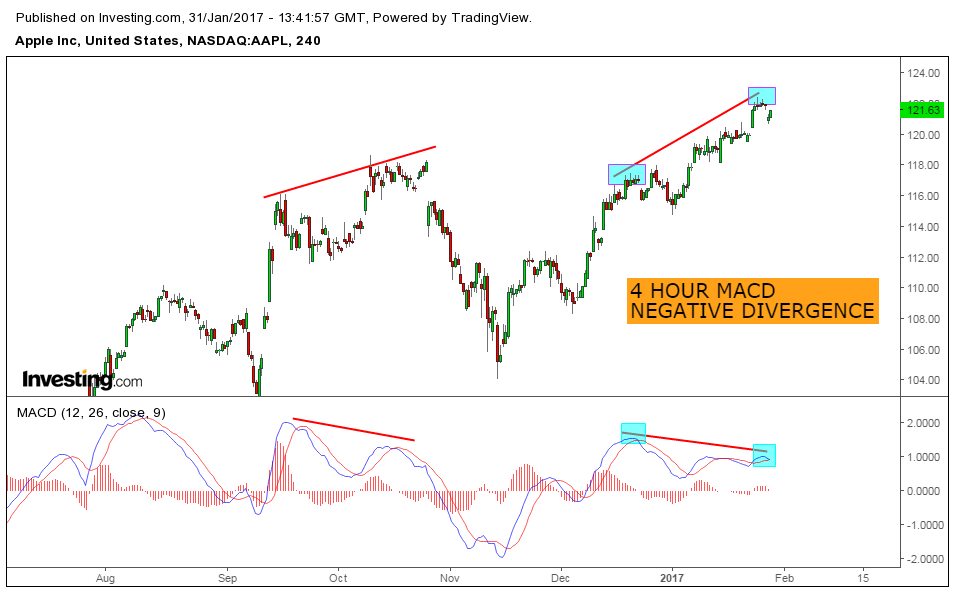
- Apple 4 Hour chart shows negative divergence.
- 2nd chart shows price testing resistance line in daily chart.
- Last chart is the 4 hour time frame again with a rising wedge kind of contraction.
-
ES Analysis before opening bell
-->
- Most crucial support line for ES is the 200 Period SMA shown in first chart. Close below this line will strengthen ES bears further.
- Cloud in 30 Minutes and 200 Hour SMA of 60 Minutes are immediate resistance levels. Bulls need to move above these levels to avoid bigger correction
- Immediate levels to resume weakness is 2267 and 2263 levels on the down side.
- ES Analysis after closing bell
-->
- The spike outside the rising wedge has failed.
- Price falling fast towards 50 Day SMA.
- Staying below 821 price likely to test 50 Day SMA.
- GOOGLE Analysis before Results
-->
- Falling price was stopped at the Triangle resistance line.
- Now 2272 and 20 Day SMA are crucial numbers for bears to close below.
- Many bulls got in after the Triangle breakout and above 2278 So If that breakout and 2278 becomes invalid many bulls would panic which can result in bigger falls.
- For that Scenario bears need to close below 2272 and 20 Day SMA till then Bulls are safe.
- GOLD Chart update
-->
- Gold 4 hour chart shows price bouncing back to the broken cloud and 100 Period SMA.
- Immediate strength and weakness levels are shown in one hour chart. Trading above 200 Period on closing basis may tilt the balance in favour of Gold bulls. Trading below 1190 will resume correction.
-->