- ES 30 Minutes and One hour time frame shows price in an up trend.
- Weakness if price starts to trade below 30 Minutes cloud.
- APPLE CHART UPDATE
-->
- APPLE continues to fade the gap in daily chart. Price has closed above 100 Day SMA. If sustains above this level bulls will be able to target 50 Day SMA and close the GAP completely.
- Price is moving up towards the broken cloud. Weakness at cloud may give shorting opportunity.
- CISCO Nearing resistance levels
-->
- Cisco daily chart shows price nearing the recent swing high. last result gap is partially filled. The unfilled portion of that GAP may continue to act as resistance.
- Bears also has the advantage of 200 Day SMA as resistance.
- Weekly MACD looks bullish But price is testing 50 Week SMA.
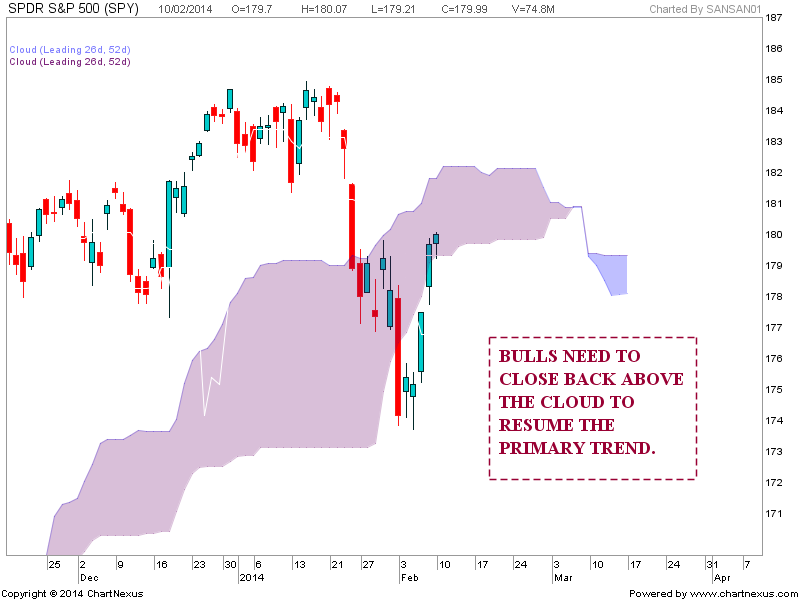
- SPY ANALYSIS AFTER CLOSING BELL
- SPY Daily chart shows price testing 20 Day SMA. This zone with 20 and 50 Day SMA may act as stiff resistance level.
- Bulls are showing a Daily MACD Bullish cross. Recent bullish crosses has done well for bulls as shown in 2nd chart.
- Last chart shows price reentering the cloud. Bulls need to break back above the cloud to resume the primary trend.
- GOLD Near Resistance levels
-->
- Crude oil daily chart shows price testing the recent swing high and 200 Day SMA.
- 4 Hour chart shows rising cloud as crucial support level. Weakness at the swing high may result in a fall towards the cloud. Bigger weakness on price trading below the cloud at 96.80 levels.
- GOLD Near Resistance levels
-->