- EURUSD Daily chart continues to show weakness near the cloud.
- Hour chart shows a descending triangle breakdown. If price remains below this pattern further correction is possible. Strength only if price closes back above this pattern.
- ES One hour chart shows price testing the cloud and 100 Hour SMA again.
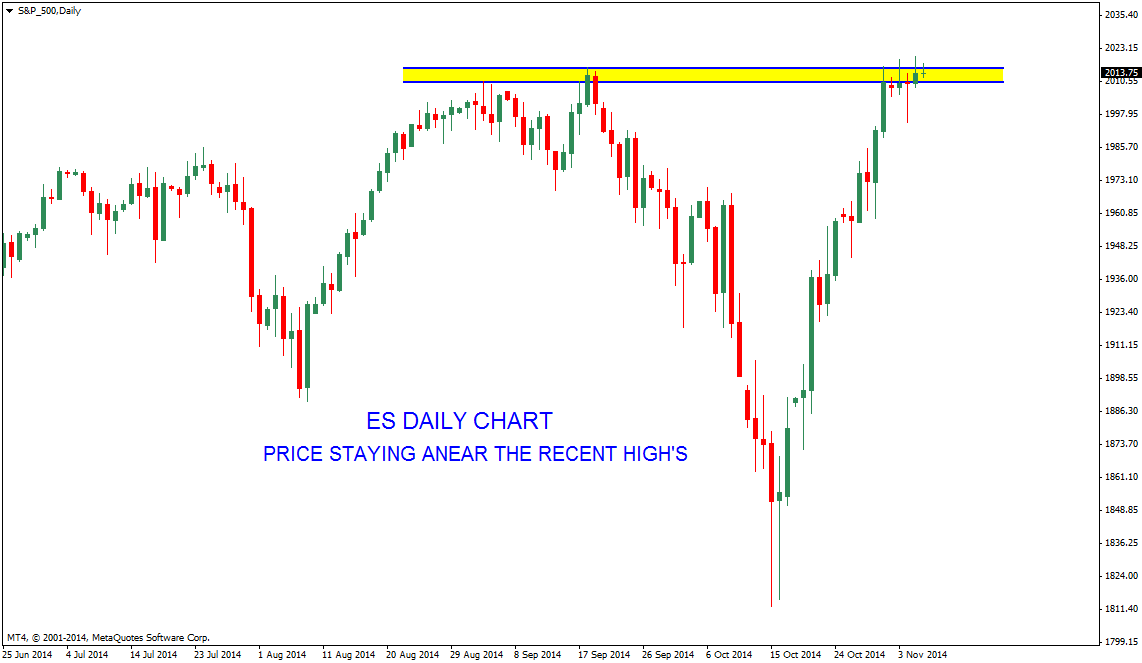
- Daily chart shows price testing the recent High's. Its likely that price may remain in a range for sometime before making a big move from here.

- Reliance power has given a bearish engulfing at 200 Day SMA
- For bulls of this stock price need to stay above 50 Day SMA.
- Week if confirms a bearish candle below 20 week sma, stock may fall towards 69 levels again. Hope for bulls only above 200 Day SMA.
-->