- SPX is trading below its 50 hour moving average
- Important support is at 1167.
- Staying below the 50 hour moving average and breaking 1167 will deepen the correction.
- If 1167 holds an up move from here is possible.
- US DOLLAR INDEX : BROADENING TOP AND HNS PATTERN
My blog Analyses the trend and patterns of stocks, Futures, Commodities and Forex Markets
October 21, 2010
S&P 500 Near 50 hour moving average
GBPUSD Broadening Top pattern
- GBP/USD is showing a broadening top pattern.
- Broadening top is known for its bearishness but has seen them breakout on the upside as well.
S&P 500 futures before opening bell
CHART-III
- It turned out to be another false breakout.
- Break of the support line will favour bears
CHART-II
- ES has given a breakout from the ascending triangle shown below.
- IF sustains above 1182 will target 1190 and 1200 soon.
CHART-I
- S&P 500 Futures is showing an ascending triangle pattern.
- Index has again found resistance at 1182 area. But Price is converging towards the apex of the triangle pattern which will give direction soon.
- S&P 500 ANALYSIS AFTER CLOSING BELL
Pin Bar and Falling Wedge of nifty futures
CHART-II
CHART-I
- PIN BAR and FALLING WEDGE has given a breakout above the resistance line of the wedge.
- But NF was sold off from intraday high suggesting profit booking.
- Breakouts of patterns is usually followed by a retest of the breakout area. So we may see a retrace of this move. Or a gap up tomorrow. many possibilities exist But bulls have the momentum.
Nifty Futures resistance levels
- Resistance levels for nifty futures shown in 15 minutes chart.
- First resistance where NF has already tried and failed to cross is 6132.
- If NF manages to cross 6132 it may move till 6161 where it will take a pause again.
- RELIANCE INDUSTRIES UPDATE
Nifty Futures Intraday update
CHART-II
- NIFTY Futures gets out of the range successfully. First target 6116.
CHART-I
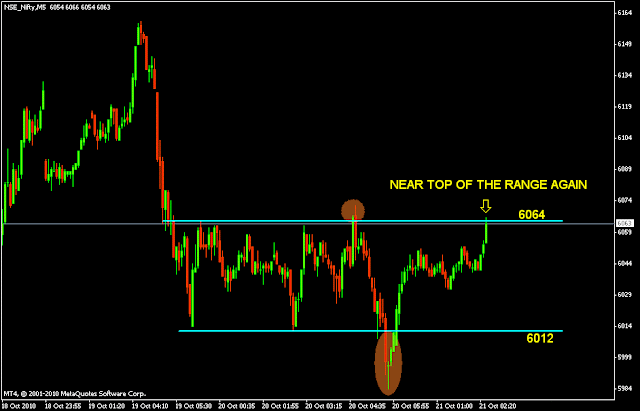
- Nifty Futures showing a range of 6012 - 6064.
- Twice it tried to breakout of the range. This one is the third attempt getting resisted here will push NF back into the range.
- Breakout attempt for the 3rd time may give good direction.
- RELIANCE INDUSTRIES ANALYSIS
Reliance Industries analysis
- Reliance industries is trading near an important weekly resistance line.
- Resistance line seems to be strong. But Breakout above this line cannot be ruled out. 1081 and 1094 will act as resistance on its way up. Large move towards 1048 is possible if 1094 is taken out convincingly.
- Getting resisted here and breaking below the small trend line drawn in weekly chart can bring the stock below 1000.
Nifty daily analysis
- Nifty has taken support yesterday near 5963 levels. If it holds the falling wedge pattern may play out. If the support does not hold then the next support lies at 5932 which will make the wedge pattern invalid.
- If the falling wedge pattern gives a breakout one has to make sure that the price closes above the 10 DMA for it to be effective.
- PIN BAR AND FALLING WEDGE OF NIFTY FUTURES
S&P 500 Analysis after closing bell
- S&P 500 Daily chart with 10 DMA.
- Every time spx dips and closes below 10 dma it is followed by a day of good buying. That shows the interest of bulls in keeping this up trend intact.
- Now if the recent high is broken spx will cross 1200.
- SELLING ZONE OF DOW JONES FUTURES
The Silver Triangle
- Four hour chart of silver showing a triangle formation
- A Breakdown below 23.20 or a breakout above 23.45 will lead to the next large movement in this commodity.
Selling Zone of Dow Jones Futures
- Dow Jones Futures Four hour chart with resistance zone.
- The supply zone is a 20 point region from 11080 - 11100.
- Any up move will unfold only if price is able to cross this level convincingly.
- S&P 500 RESISTANCE LEVELS
Subscribe to:
Comments (Atom)


