30 MINUTES CHART
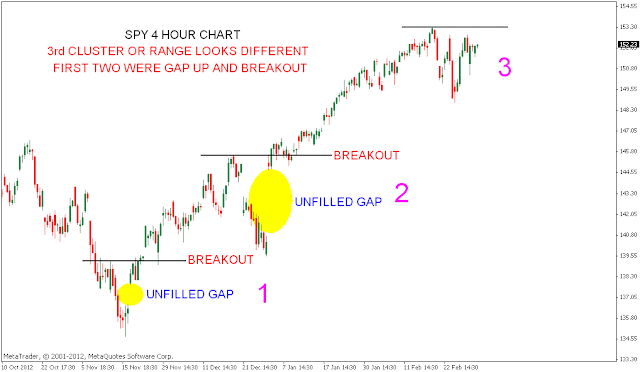
4 HOUR CHART

- First chart shows 30 Minutes time frame with the Ascending triangle.
- Second chart analyses the current up move in 4 Hour time frame. Two runaway GAP's and good up moves followed. But current pullback looks different. That doesn't mean Bulls are not going to get a breakout But chances of a false breakout is likely. Two unfilled GAP's in chart too will keep the bears interested.
- APPLE CHART UPDATE


No comments:
Post a Comment