- Ford Motor in a descending channel and price approaching the up trend line as shown in the first chart.
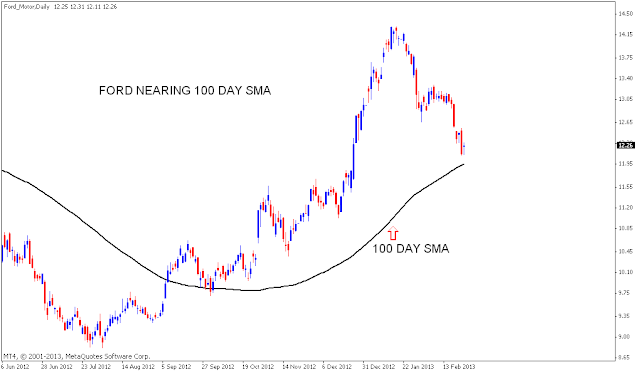
- Second chart shows price falling towards 100 Day SMA. Last chart shows price testing 38.2% Fib level.
- This correction is likely to end at the up trend line or 100 Day SMA and a Bounce towards 23.6% Fib level is likely to happen.
- EURUSD CHART ANALYSIS


No comments:
Post a Comment