- ES one hour chart shows a bullish channel. As price moves up inside the channel MACD continues to show negative divergence. Reaction for negative divergence may happen only if price break below the channel and 50 Hour SMA.
- This up move of ES Bulls will continue to remain strong till price stay above 50 Hour SMA
My blog Analyses the trend and patterns of stocks, Futures, Commodities and Forex Markets
October 5, 2017
ES Hour chart analysis
Alphabet Charts, GOOGL in a range
- Alphabet daily in range
- Price likely to remain within the larger range. There could be false spikes out of the small range shown in above chart. Small range being 961 - 977.
- Bigger range of Google between 929 - 1008
October 4, 2017
ES Hour chart analysis
- ES one hour chart shows immediate support at 50 Hour SMA. Price falling below 2529 and 50 Hour SMA will favour bears for the day.
- Trend change in hour will happen only if price falls below the cloud.
Bank nifty technical analysis
- Weekly chart of BN shows bears trying to form a Top. Price need to stay below 23800 levels on weekly closing basis for bigger corrections to follow.
- Closing the week below 20 Week SMA Line may also strengthen bears. So BN bulls need to stay above both these levels.
- One hour chart shows a bullish inverted head and shoulders pattern. Last chart shows the bullish pattern and price positioned below the cloud which is bearish. Price moving below 24000 will favour bears in hourly chart. Hour will turn bullish above the cloud...
- NIFTY Weekend update
October 3, 2017
TESLA Inc Technical Analysis
- First chart with the rising support line gives hope for Tesla bulls for a reversal.
- But the Second chart is not that exciting as price is staying below 100 SMA for now. Tesla bulls need to do more to close back above this crucial moving average to confirm strength.
- The Month chart also looks Weak with the two long upper shadows of June and September month candles. If price manage to close above 100 SMA a short term up move is likely, After this the Month weakness may resume..
- QQQ CHART ANALYSIS
QQQ Technical levels before opening bell
- QQQ Daily is getting strong support near 100 Day SMA.
- There is negative divergence with PRICE and RSI In daily time frame. But bears need to close below 100 SMA for a possible trend change to happen in this time frame.
- Immediate weakness if day closes below 144.93 levels. On the up side price nearing resistance level again146.59
October 2, 2017
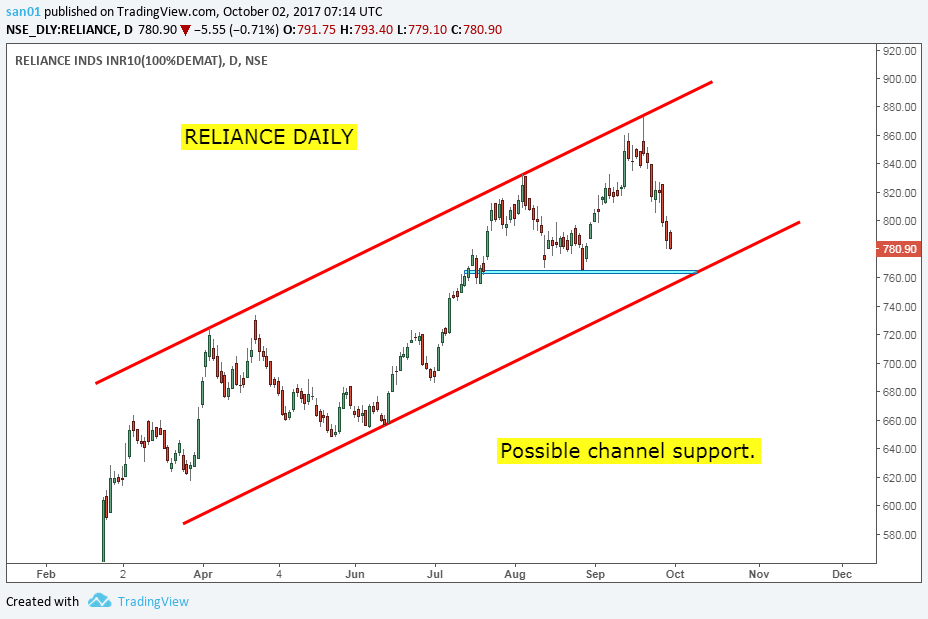
RELIANCE Industries Chart analysis
- Month candle not looking exciting for bulls. Price action near historic resistance levels is looking weak for now.
- Daily too is trying to make a Top. But all is not lost for Bulls. Daily is nearing crucial support levels around 100 Day SMA and possible channel support around 760 levels.
- Bears will gain more strength if the above mentioned levels are not held on closing basis.
- Bulls may hope to see a bounce from 100 Day SMA.
- NIFTY CHART ANALYSIS
Subscribe to:
Posts (Atom)