
- Hourly chart continues its trending move above the Ichimoku cloud.
- Price is staying above 50 Day SMA.
- Hope for bears in the Resistance levels shown in first chart. Weakness here may lead to a correction. But first Hour chart needs to break below the cloud for a possible bearish trade to happen.
- Weekly and Daily are testing resistance lines. But no alarms for Bulls yet as price is not showing weakness.
- Positional support for BN is around 16220 - 16260 region and the GAP as shown in second chart.
- Daily MACD is showing negative divergence. But both MACD and Price yet to show sell signals.
- CRUDE OIL MONTHLY Chart analysis
- SILVER TREND UPDATE
-->

- The Month time frame is shown with Fibonacci levels. It shows a broad range between 38.2% and Golden ratio. So this is roughly between 74 - 77 to 103 - 112. Price right now is testing the bottom of this range.
- Second chart is the weekly time frame with possible support levels.
- Ichimoku cloud of Daily Time Frame will act as shield for Crude oil bears.
- 4 Hour time frame shows a bearish Descending triangle pattern. Mostly acts as a trend continuation pattern.
- Crude oil bulls must hope for a Basing formation around 74 - 77 for a possible up move to happen.
- EURUSD Trend Update
- SILVER TREND UPDATE
-->
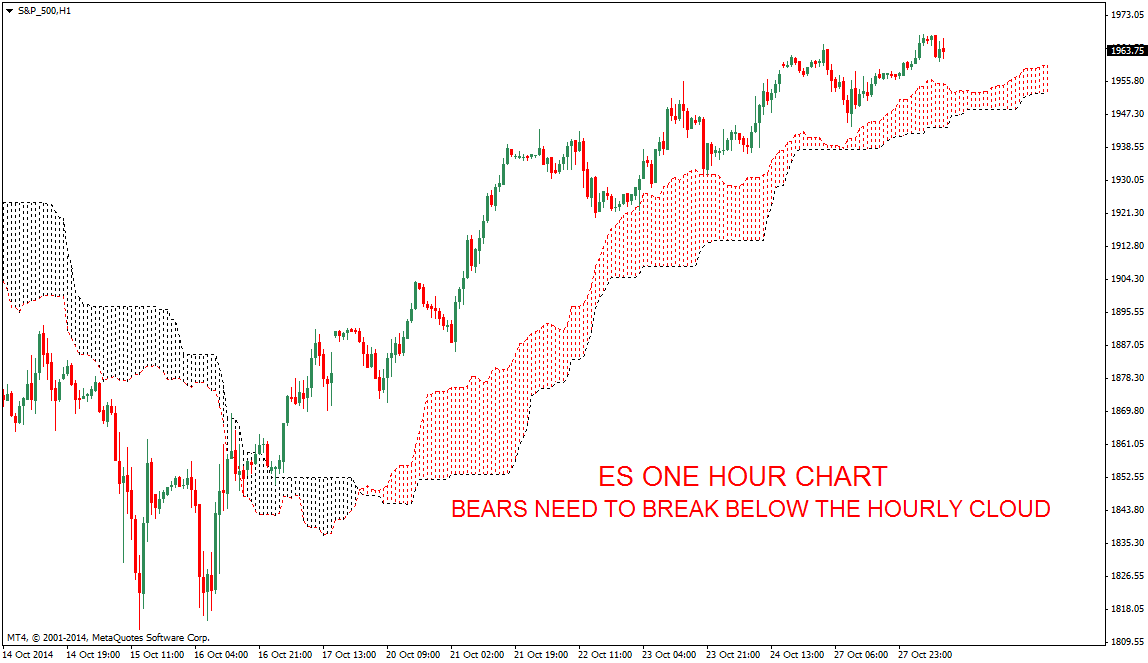
- ES Higher time frames are showing price at a crucial support resistance zone.
- Hourly charts are showing a nice trending move favoring bulls, That may end if the daily TF Fails to make a bullish close above 50 Day SMA. First chart also shows price testing a crucial support resistance zone.
- For the very short term price must stay above the Hourly cloud for bulls to extend this up move.
- EURUSD Trend Update
- Silver Month week and Day time frames shows strong down trend.
- Daily time frame will continue to favor bears as it stays below 50 and 200 Day SMA.
-
GOLD WEEKLY SUPPORT ZONE
-->
- First chart shows the Monthly time frame which is near a support band between 1.20 - 1.25.
- Weekly chart shows a Bearish flag breakdown with possible target of 1.20 levels. Weekly close below 1.20 will further extend the down trend.
- Daily chart too shows the Ichimoku cloud as strong resistance. Any possible bounce only on price staying above the cloud.
- Gold Weekly chart shows price trying to find support near the 1180 levels.
- Daily chart is yet to clear 50 Day SMA. Unable to move above this level and 200 SMA may lead to further falls.
- 4 Hour and One hour charts are trying to stay above the cloud. Price staying above 4 Hour cloud will give hope for Gold bulls.


