- EURUSD Weekly chart shows price testing crucial resistance levels. More strength for EURUSD only on trading above 1.3711 levels. 2nd chart shows price trying to sustain above 200 Day SMA unlike the previous two attempts. Daily chart shows immediate support and resistance levels.
- US Dollar Chart update
-->

- APPLE Weekly chart shows price violating crucial resistance levels. Weekly close above 100 Week SMA and 38.2% will add strength for apple bulls. For trend reversal price must trade above the weekly cloud.
- CRUDE Oil testing 200 day sma
-->
- Crude oil daily chart shows price testing 200 Day SMA and 50% retrace level. 4 Hour chart shows weakness below 4 Hour cloud. Crude oil bears need a close below 200 SMA to extend gains towards the Golden ratio.
- US Dollar Weekend update
-->
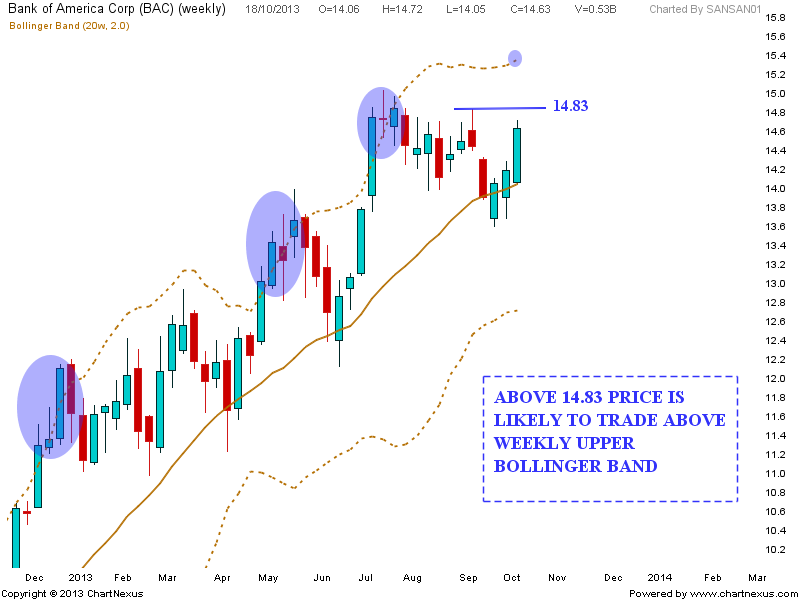
- Bank of America testing a possible resistance line in daily chart.
- Weekly charts though continues to show bullishness. Trading above 14.83 levels BAC is likely to move above the upper Bollinger Band.
- US Dollar Weekend update
-->
- JPM Weekly chart shows price nearing the broken resistance line which may act as resistance.
- Daily chart shows price testing the Golden ratio which has to be crossed for extending the current up move. Immediate support in daily chart is the 100 Day SMA. Closing below 100 SMA may result in a fall back to 50 levels again.
- US Dollar Weekend update
-->
- Bank nifty Testing crucial resistance levels in 100 Week SMA and nearing 50% Fib level. Weekly MACD looks bullish and needs price to sustain above 100 Week SMA for extending this up move.
- US Dollar Weekly chart shows price testing weekly support line.
- Daily chart also shows price testing crucial support lines.
- Last chart shows the Death cross in daily chart. US Dollar will continue to stay weak on sustaining below 50 Day SMA.
- SPY Weekend update
-->