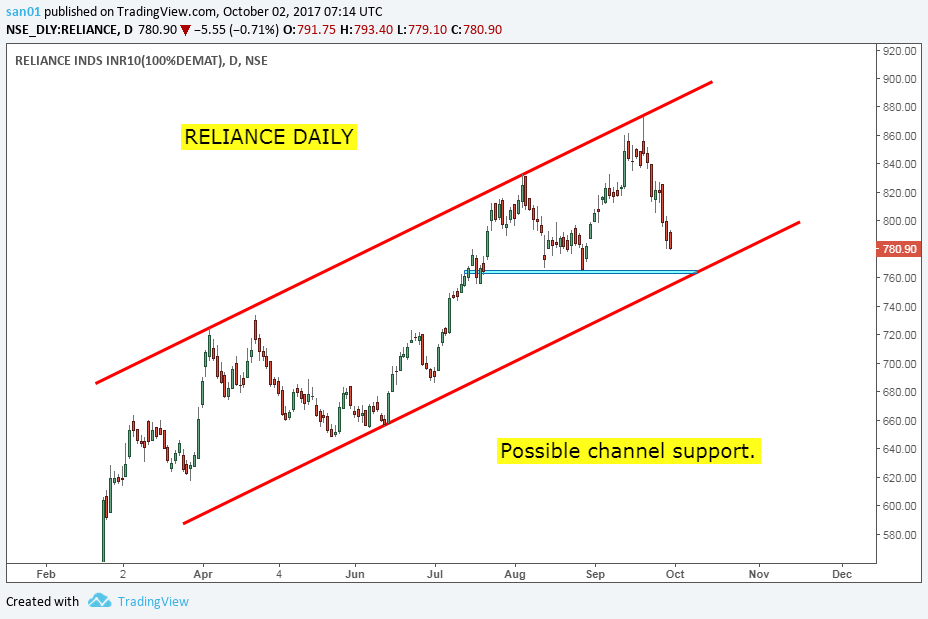
- Month candle not looking exciting for bulls. Price action near historic resistance levels is looking weak for now.
- Daily too is trying to make a Top. But all is not lost for Bulls. Daily is nearing crucial support levels around 100 Day SMA and possible channel support around 760 levels.
- Bears will gain more strength if the above mentioned levels are not held on closing basis.
- Bulls may hope to see a bounce from 100 Day SMA.
- NIFTY CHART ANALYSIS
-->
- Apple one hour may turn positive if price moves above the cloud.
- Levels to watch on daily time frame are 155 and the moving averages 20 and 50. Bears need to keep price below 50 SMA to avoid a bigger up move.
- Levels for bears to break are 152 and 149 levels. Hourly down trend will resume below these levels.
- ES Weekend update
-->
- ES Daily chart shows the continuation breakout.
- Weekly time frame shows the Negative divergence which stands invalid as of now.
- 4 Hour chart shows breakout above resistance level 2506. Bulls will remain strong above this level for the coming week. Bears need to fall back below this level for a possible correction to start.
-->
- Nifty Week is resting at a crucial price zone. 9700 and 20 Week SMA has to be protected by Nifty bulls to avoid further correction.
- Nifty bears must defend 50 Day SMA as shown in last chart. Staying below 50 Day SMA Bears will be able to extend correction further.
- Bearish view will negate only if Bulls are able to get back above 50 SMA again.
- NIFTY Month Week and Daily charts
-->
- Crucial support level in daily at 2475 as shown in first chart. Bulls will remain strong above this zone.
- Immediate Weakness only on price violating the 20 Day SMA and the Price levels shown in Last chart.
-->
- ES Weekly chart shows negative divergence. Price is at the top of the range so a small correction is possible. For a bigger reversal in weekly time frame the levels mentioned in chart 2 and 3 must be broken on closing basis.
- Immediate weakness on staying below 2475 levels.
-->
- Month Chart is pausing near a possible resistance line.
- Weekly chart is showing slight bearishness with an engulfing pattern, This pattern needs follow up price action to confirm bearishness.
- The levels for bears to conquer are 50 Day SMA in daily time frame, In Week its around 9780 for next week. Week closing below this level will tilt the balance in favour of bears. In month its 9600. But for now bulls need to defend 50 Day SMA. If price stays above this moving average then the bearish view will be negated for now.
-->