- ES one hour chart shows resistance at 38.2% Fib level and cloud. Bulls need to cross these two levels for a bigger bounce to happen.
- Bears need to break below the support line shown in 4 hour chart for bigger breakdown to happen. For now price is within a range or channel in 4 hour chart.

- 4 Hour shows a possible support line.
- 15 Minutes shows strong trend below the cloud. Bears remain strong till price stay below 15 Minutes cloud

- Nifty is getting resisted at the recent swing high of 7972 level. Last chart shows a possible inverted heads and shoulders pattern. Price need to stay above 7700 levels for this possibility to remain strong. retest of recent lows are possible if 7700 levels are not held. Speed of the current fall may also be a concern for bulls. Intraday needs to stay above 200 Hour SMA shown around 7810 levels for a possible reversal to happen.
- nifty support and resistance levels
-->

- Apple Daily chart has a death cross and if price remains below SMA bearish will stay stronger.
- Support zone or neck line for head and shoulders pattern is around 104 levels.
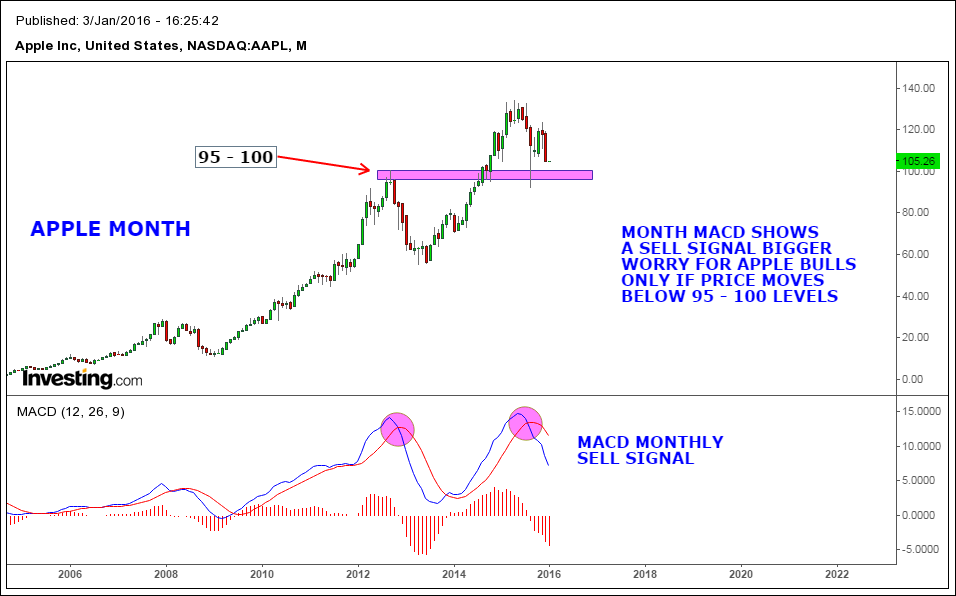
- Month chart too shows a sell signal in MACD indicator. Apple bulls will further weaken if price moves below 95 - 100 zone. This zone was previous resistance as shown in monthly chart and can act as strong support zone.

- Crude oil month chart shows Bulls trying to hold above the 2008 lows. Weekly chart is trying to put up a bullish reversal pattern. But price need to stay within this pattern any new lows if made will negate the bullish possibility. If weekly reversal pattern gives a successful breakout pattern rules gives a target around 60 levels. Immediate resistance at 38 levels as shown in Daily time frame.
- ES Bulls need price to stay above 200 Hour SMA to avoid bigger correction. 2035 level shown in 4 hour chart is a crucial support zone to hold. Strength only if price stays above 2075 levels.

- ES 4 hour chart shows price near the apex of ascending triangle. One hour chart shows price near support line, If holds an upper breakout is likely.