- ES bulls continues to struggle at 78.6% Fib level and the channel support line.
- Price is staying above crucial moving averages as shown in last chart.
- For bears price sustaining below 50 Period SMA may lead to a bigger fall.
- SPX Daily taking support at 23.6% Fib level.
- Second chart shows price testing middle line of the ascending channel. Price has to close below this line for bears to have a correction towards 1530 levels initially.
- Weekly chart shows negative divergence with price and rsi. RSI falling below 70% line may give a bigger fall.
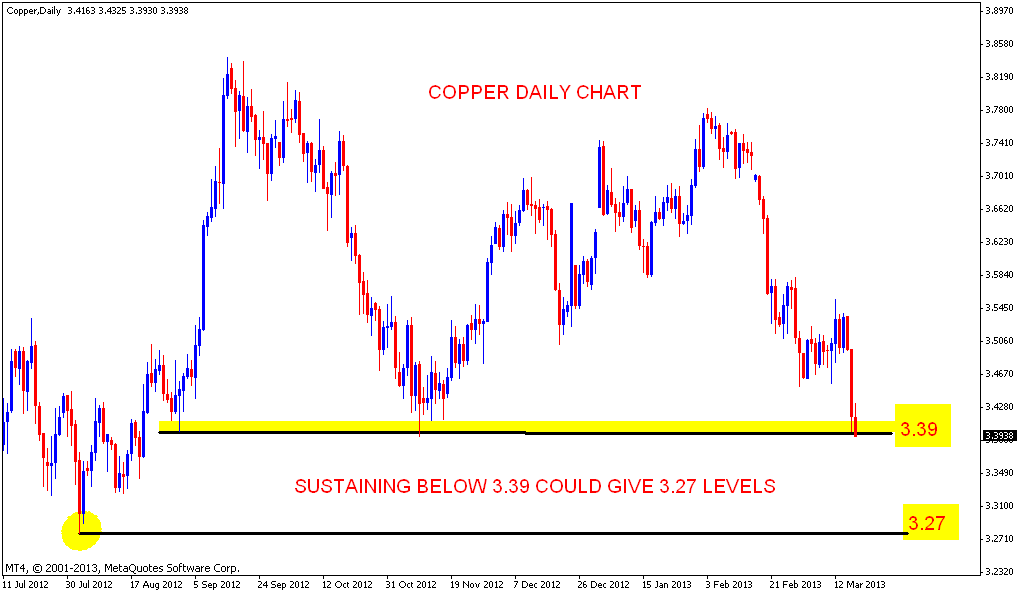
- Copper has broken the support line of the weekly triangle pattern.
- Daily chart shows price testing crucial support level.
- Sustaining below 3.39 levels may push price down towards 3.27 levels.
- ES bulls need to break above 78.6 % Fib level and Hourly cloud to extend the up move.
- Broken channel support line is also acting as resistance.
- Unable to clear the above mentioned levels may lead to a correction.
4 HOUR CHARTS
ONE HOUR CHART
- APPLE 4 Hour charts are approaching crucial resistance levels.
- 4 Hour cloud and 100 period SMA will be tough to cross for apple bulls.
- One hour chart has moved above 50 and 200 Hour SMA. Sustaining above these two levels may lead to bigger up moves. So apple bears need price to fall back below 200 Hour SMA.
- ES CHART UPDATE
-->
- Last chart of ES Shows the one hour time frame with the broken channel which may act as resistance level.
- Price found support at 38.2% Fib level and 100 Period SMA shown in four hour chart. Now price is nearing possible resistance levels.
-
ES UPDATE
-->
- Nifty will continue to favor bears below 50 Day SMA and Golden ratio.
- Last chart shows daily line chart. Bulls are safe above the middle line of the channel. Once price closes below the middle line we could see a larger correction.
- S&P 500 FUTURES CHART ANALYSIS
-->