- First chart shows price retesting the breakdown level of the bearish pattern.
- If price manage to sustain above 20 and 200 SMA then it could move towards the falling resistance level of the drawn pattern.

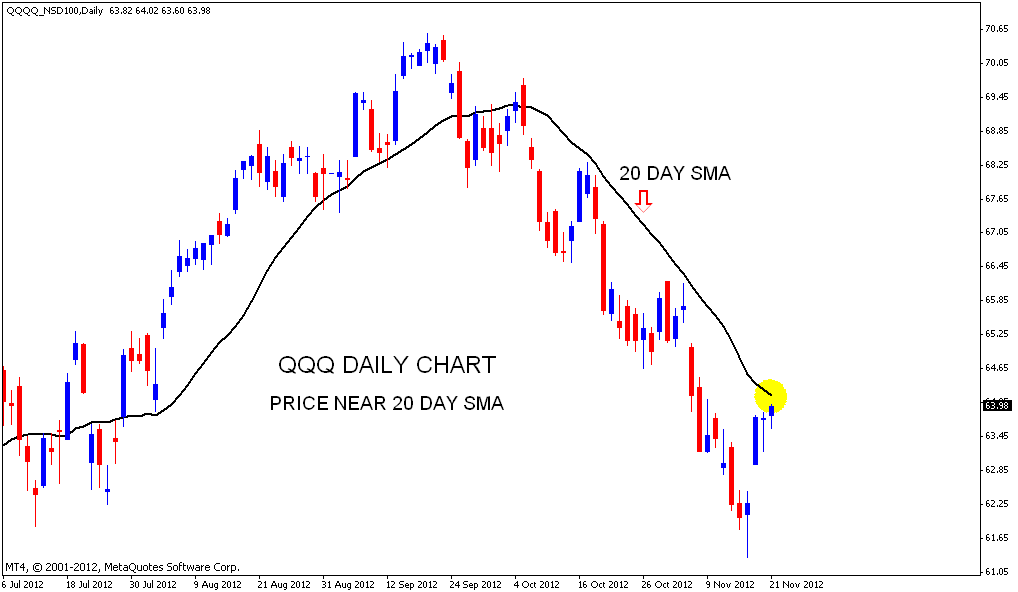
- QQQ Daily chart near 20 Day SMA.
- 4 Hour chart shows price testing the falling resistance line.
- For a bigger pullback price must close the day above 20 Day SMA.
- Next fib resistance of 38.2% Near 64.85 levels.
- ES Daily chart shows resistance at 38.2% Fib level.
- 4 Hour chart shows resistance at 100 period sma. This time frame also shows resistance zone between 1387 - 1393. Bigger up move possible only on trading above these levels.
- Apples up move found resistance at 20 Day SMA.
- Weekly chart too shows price back below 50 Week SMA.
- Weekly chart with Ichimoku cloud shows price trying to stay above the cloud. For the long term up trend to be intact price on weekly chart must stay above the cloud.

- Nifty daily trying to stay above a falling support line. If this line is not broken we may see an up move.
- Weekly chart is showing a MACD Sell signal . If the MACD signal takes effect then price may slide towards Weekly middle bollinger band. A weekly close below this level could bigger down moves for nifty.
- So for bulls price should sustain above the falling support line and should move above the 50 Day SMA.

- ES nearing the broken support level or the neck line of the head and shoulders pattern.
- Second chart shows price with 20 and 200 Day SMA. The current setup looks very similar to the one happened on the left hand side which means more up moves to come. For bulls price need to sustain above 20 Day SMA.
- Fib level shows the Golden ratio reversal and price at the broken 38.2% Fib level.