CLICK TO ENLARGE
CHART-III
- 5824 NF seems to have given support for now. Closing above this will be good for the bulls.
CHART-II
- Today's bullish Hour candle being engulfed by a bearish one. It was a result of a doji that stood between the bull and the bear
CHART-I
- The hour candle has given a doji which has come at the top of the trend.
- Bulls are safe if NF trades above 5824
CHART - II
CHART - I
- NF has broken the resistance zone.
- NF will target 5900 today.
CHART-III
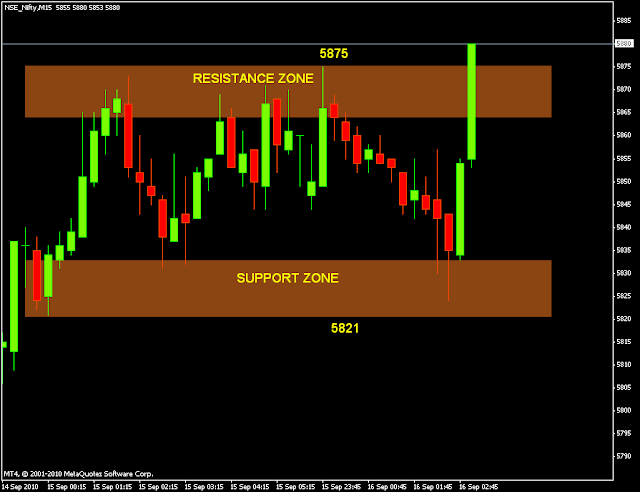
CHART - II

CHART - I
- Nifty 15 Minutes chart is showing a resistance zone from which selling is happening for the last two day's.
- So Trading above this area will be very positive for the index and NF will try to cross 5900 above this resistance zone.
- So what is the target of this weekly channel breakout?
- The Broad range nifty was trading before the channel breakout was about 600 points.
- The breakout happened at 5620 levels.
- So even if one Trades for 300 points he should wait for 5900 to come.
- Reliance is trading above 1007. Above 1007 stock can target 1030.
- 1007 and 993 should act as support now.
- Fresh longs are not suggested. But those who are long from 958 levels can hold with T S L.
- Daily chart of tata motors is showing bearish engulfing pattern.
- Now if the stock closes below 20 dma, stock may come down to 1008. Below 1008 stock will see some more correction.
- One should wait for the sell signal to come. We can't enter a trade just because of bearish engulfing, But price confirmation is the most important criteria.
- First chart shows Dow Jones trading above its 10 and 50 DMA.
- Now Bulls should be worried only if the price closes below the 10 DMA.
- The 2nd chart shows the Dow Jones Futures chart Breaking out of a triangle. IF Dow Futures sustains above 10500 it will favour the bulls.


